Data
83,911 items of data are available, covering 79,384 participants.
Defined-instances run from 2 to 3, labelled using Instancing
2.
Units of measurement are AU.
| Maximum | 0.003525 |
| Decile 9 | 0.001889 |
| Decile 8 | 0.001629 |
| Decile 7 | 0.001483 |
| Decile 6 | 0.001376 |
| Median | 0.001288 |
| Decile 4 | 0.001207 |
| Decile 3 | 0.00113 |
| Decile 2 | 0.001049 |
| Decile 1 | 0.000954 |
| Minimum | 0.000586 |
|

|
- Mean = 0.0013659
- Std.dev = 0.000386269
- 205 items above graph maximum of 0.002824
|
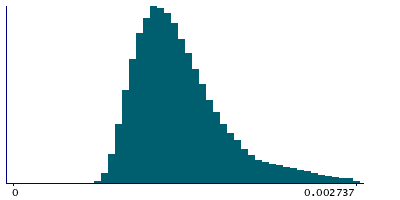
2 Instances
Instance 2 : Imaging visit (2014+)
79,153 participants, 79,153 items
| Maximum | 0.003525 |
| Decile 9 | 0.001893 |
| Decile 8 | 0.001632 |
| Decile 7 | 0.001486 |
| Decile 6 | 0.001379 |
| Median | 0.00129 |
| Decile 4 | 0.0012085 |
| Decile 3 | 0.001131 |
| Decile 2 | 0.00105 |
| Decile 1 | 0.000955 |
| Minimum | 0.000586 |
|
|
- Mean = 0.00136811
- Std.dev = 0.000387194
- 188 items above graph maximum of 0.002831
|
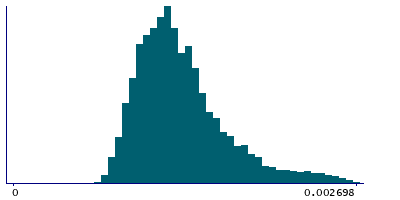
Instance 3 : First repeat imaging visit (2019+)
4,758 participants, 4,758 items
| Maximum | 0.003056 |
| Decile 9 | 0.00182 |
| Decile 8 | 0.001571 |
| Decile 7 | 0.0014295 |
| Decile 6 | 0.001339 |
| Median | 0.001253 |
| Decile 4 | 0.001183 |
| Decile 3 | 0.001109 |
| Decile 2 | 0.001031 |
| Decile 1 | 0.000942 |
| Minimum | 0.000653 |
|
|
- Mean = 0.00132899
- Std.dev = 0.000368591
- 20 items above graph maximum of 0.002698
|
Notes
Mean L2 in fornix on FA (fractional anisotropy) skeleton (from dMRI data)
0 Related Data-Fields
There are no related data-fields
2 Applications
| Application ID | Title |
|---|
| 17689 | Genetic, environmental and lifestyle predictors of brain/cognitive-related outcomes. |
| 22783 | The joint analysis of imaging data and genetic data for early tumor detection, prevention, diagnosis and treatment |

