Data
83,911 items of data are available, covering 79,384 participants.
Defined-instances run from 2 to 3, labelled using Instancing
2.
Units of measurement are AU.
| Maximum | 0.00209 |
| Decile 9 | 0.001314 |
| Decile 8 | 0.00129 |
| Decile 7 | 0.001273 |
| Decile 6 | 0.001259 |
| Median | 0.001246 |
| Decile 4 | 0.001233 |
| Decile 3 | 0.001218 |
| Decile 2 | 0.001202 |
| Decile 1 | 0.001179 |
| Minimum | 0 |
|
|
- Mean = 0.00124635
- Std.dev = 5.4206e-05
- 26 items below graph minimum of 0.001044
- 67 items above graph maximum of 0.001449
|
2 Instances
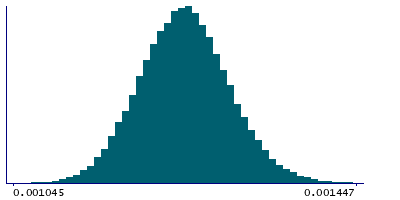
Instance 2 : Imaging visit (2014+)
79,153 participants, 79,153 items
| Maximum | 0.00209 |
| Decile 9 | 0.001315 |
| Decile 8 | 0.001291 |
| Decile 7 | 0.001274 |
| Decile 6 | 0.001259 |
| Median | 0.001246 |
| Decile 4 | 0.001233 |
| Decile 3 | 0.001219 |
| Decile 2 | 0.001203 |
| Decile 1 | 0.00118 |
| Minimum | 0 |
|

|
- Mean = 0.00124711
- Std.dev = 5.41912e-05
- 25 items below graph minimum of 0.001045
- 57 items above graph maximum of 0.00145
|
Instance 3 : First repeat imaging visit (2019+)
4,758 participants, 4,758 items
| Maximum | 0.00182 |
| Decile 9 | 0.001299 |
| Decile 8 | 0.001276 |
| Decile 7 | 0.00126 |
| Decile 6 | 0.001246 |
| Median | 0.001233 |
| Decile 4 | 0.001221 |
| Decile 3 | 0.001206 |
| Decile 2 | 0.00119 |
| Decile 1 | 0.001168 |
| Minimum | 0.001018 |
|

|
- Mean = 0.00123374
- Std.dev = 5.28798e-05
- 1 item below graph minimum of 0.001037
- 7 items above graph maximum of 0.00143
|
Notes
Mean L1 in uncinate fasciculus (right) on FA (fractional anisotropy) skeleton (from dMRI data)
0 Related Data-Fields
There are no related data-fields
2 Applications
| Application ID | Title |
|---|
| 17689 | Genetic, environmental and lifestyle predictors of brain/cognitive-related outcomes. |
| 22783 | The joint analysis of imaging data and genetic data for early tumor detection, prevention, diagnosis and treatment |

