Data
83,911 items of data are available, covering 79,384 participants.
Defined-instances run from 2 to 3, labelled using Instancing
2.
Units of measurement are AU.
| Maximum | 0.001671 |
| Decile 9 | 0.001244 |
| Decile 8 | 0.001224 |
| Decile 7 | 0.001211 |
| Decile 6 | 0.0012 |
| Median | 0.00119 |
| Decile 4 | 0.00118 |
| Decile 3 | 0.00117 |
| Decile 2 | 0.001159 |
| Decile 1 | 0.001142 |
| Minimum | 0.000793 |
|
|
- Mean = 0.00119238
- Std.dev = 4.16148e-05
- 20 items below graph minimum of 0.00104
- 231 items above graph maximum of 0.001346
|
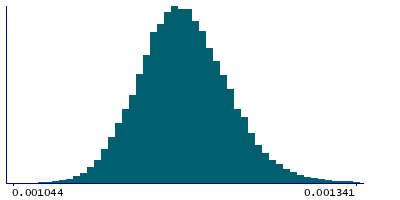
2 Instances
Instance 2 : Imaging visit (2014+)
79,153 participants, 79,153 items
| Maximum | 0.001671 |
| Decile 9 | 0.001245 |
| Decile 8 | 0.001225 |
| Decile 7 | 0.001211 |
| Decile 6 | 0.0012 |
| Median | 0.00119 |
| Decile 4 | 0.001181 |
| Decile 3 | 0.001171 |
| Decile 2 | 0.001159 |
| Decile 1 | 0.001143 |
| Minimum | 0.000793 |
|

|
- Mean = 0.0011927
- Std.dev = 4.17748e-05
- 22 items below graph minimum of 0.001041
- 225 items above graph maximum of 0.001347
|
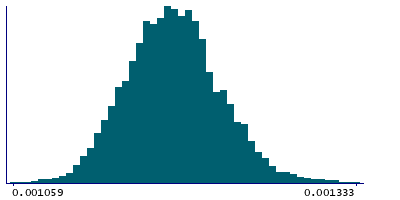
Instance 3 : First repeat imaging visit (2019+)
4,758 participants, 4,758 items
| Maximum | 0.001364 |
| Decile 9 | 0.001236 |
| Decile 8 | 0.001217 |
| Decile 7 | 0.001205 |
| Decile 6 | 0.001195 |
| Median | 0.001186 |
| Decile 4 | 0.001177 |
| Decile 3 | 0.001166 |
| Decile 2 | 0.001155 |
| Decile 1 | 0.001139 |
| Minimum | 0.001059 |
|
|
- Mean = 0.001187
- Std.dev = 3.84601e-05
- 9 items above graph maximum of 0.001333
|
Notes
Mean L1 in superior longitudinal fasciculus (left) on FA (fractional anisotropy) skeleton (from dMRI data)
0 Related Data-Fields
There are no related data-fields
2 Applications
| Application ID | Title |
|---|
| 17689 | Genetic, environmental and lifestyle predictors of brain/cognitive-related outcomes. |
| 22783 | The joint analysis of imaging data and genetic data for early tumor detection, prevention, diagnosis and treatment |

