Data
83,911 items of data are available, covering 79,384 participants.
Defined-instances run from 2 to 3, labelled using Instancing
2.
Units of measurement are AU.
| Maximum | 0.001789 |
| Decile 9 | 0.001409 |
| Decile 8 | 0.001384 |
| Decile 7 | 0.001366 |
| Decile 6 | 0.001351 |
| Median | 0.001337 |
| Decile 4 | 0.001323 |
| Decile 3 | 0.001308 |
| Decile 2 | 0.00129 |
| Decile 1 | 0.001265 |
| Minimum | 0.000664 |
|
|
- Mean = 0.00133667
- Std.dev = 5.74372e-05
- 60 items below graph minimum of 0.001121
- 16 items above graph maximum of 0.001553
|
2 Instances
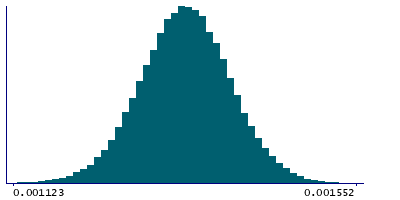
Instance 2 : Imaging visit (2014+)
79,153 participants, 79,153 items
| Maximum | 0.001789 |
| Decile 9 | 0.001409 |
| Decile 8 | 0.001384 |
| Decile 7 | 0.001366 |
| Decile 6 | 0.001351 |
| Median | 0.001337 |
| Decile 4 | 0.001323 |
| Decile 3 | 0.001308 |
| Decile 2 | 0.001289 |
| Decile 1 | 0.001264 |
| Minimum | 0.000664 |
|

|
- Mean = 0.00133648
- Std.dev = 5.76118e-05
- 54 items below graph minimum of 0.001119
- 14 items above graph maximum of 0.001554
|
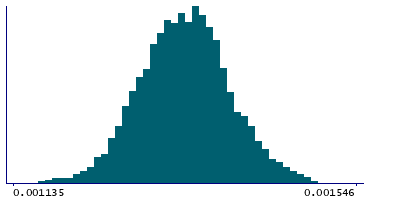
Instance 3 : First repeat imaging visit (2019+)
4,758 participants, 4,758 items
| Maximum | 0.001585 |
| Decile 9 | 0.0014095 |
| Decile 8 | 0.001383 |
| Decile 7 | 0.001368 |
| Decile 6 | 0.001354 |
| Median | 0.00134 |
| Decile 4 | 0.001326 |
| Decile 3 | 0.001312 |
| Decile 2 | 0.001294 |
| Decile 1 | 0.001272 |
| Minimum | 0.000906 |
|
|
- Mean = 0.00133979
- Std.dev = 5.43554e-05
- 2 items below graph minimum of 0.0011345
- 1 item above graph maximum of 0.001547
|
Notes
Mean L1 in cingulum cingulate gyrus (right) on FA (fractional anisotropy) skeleton (from dMRI data)
0 Related Data-Fields
There are no related data-fields
2 Applications
| Application ID | Title |
|---|
| 17689 | Genetic, environmental and lifestyle predictors of brain/cognitive-related outcomes. |
| 22783 | The joint analysis of imaging data and genetic data for early tumor detection, prevention, diagnosis and treatment |

