Data
83,911 items of data are available, covering 79,384 participants.
Defined-instances run from 2 to 3, labelled using Instancing
2.
Units of measurement are AU.
| Maximum | 0.002791 |
| Decile 9 | 0.001424 |
| Decile 8 | 0.001379 |
| Decile 7 | 0.001353 |
| Decile 6 | 0.001333 |
| Median | 0.001316 |
| Decile 4 | 0.0013 |
| Decile 3 | 0.001284 |
| Decile 2 | 0.001266 |
| Decile 1 | 0.001244 |
| Minimum | 0.000806 |
|
|
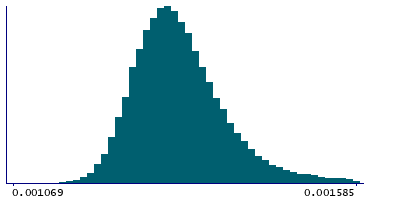
- Mean = 0.0013285
- Std.dev = 8.17699e-05
- 12 items below graph minimum of 0.001064
- 987 items above graph maximum of 0.001604
|
2 Instances
Instance 2 : Imaging visit (2014+)
79,153 participants, 79,153 items
| Maximum | 0.002791 |
| Decile 9 | 0.001425 |
| Decile 8 | 0.00138 |
| Decile 7 | 0.001354 |
| Decile 6 | 0.001334 |
| Median | 0.001317 |
| Decile 4 | 0.001301 |
| Decile 3 | 0.001285 |
| Decile 2 | 0.001267 |
| Decile 1 | 0.001244 |
| Minimum | 0.000806 |
|
|
- Mean = 0.00132936
- Std.dev = 8.21461e-05
- 11 items below graph minimum of 0.001063
- 923 items above graph maximum of 0.001606
|
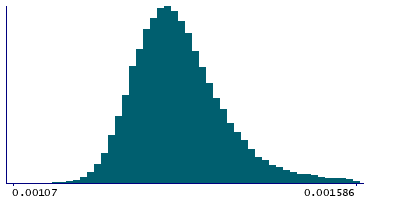
Instance 3 : First repeat imaging visit (2019+)
4,758 participants, 4,758 items
| Maximum | 0.001825 |
| Decile 9 | 0.001398 |
| Decile 8 | 0.001361 |
| Decile 7 | 0.001337 |
| Decile 6 | 0.001318 |
| Median | 0.001302 |
| Decile 4 | 0.001288 |
| Decile 3 | 0.001274 |
| Decile 2 | 0.001258 |
| Decile 1 | 0.001239 |
| Minimum | 0.001005 |
|

|
- Mean = 0.00131413
- Std.dev = 7.3768e-05
- 1 item below graph minimum of 0.00108
- 62 items above graph maximum of 0.001557
|
Notes
Mean L1 in posterior corona radiata (right) on FA (fractional anisotropy) skeleton (from dMRI data)
0 Related Data-Fields
There are no related data-fields
2 Applications
| Application ID | Title |
|---|
| 17689 | Genetic, environmental and lifestyle predictors of brain/cognitive-related outcomes. |
| 22783 | The joint analysis of imaging data and genetic data for early tumor detection, prevention, diagnosis and treatment |

