Data
83,911 items of data are available, covering 79,384 participants.
Defined-instances run from 2 to 3, labelled using Instancing
2.
Units of measurement are AU.
| Maximum | 0.002148 |
| Decile 9 | 0.00123 |
| Decile 8 | 0.001203 |
| Decile 7 | 0.001186 |
| Decile 6 | 0.001172 |
| Median | 0.00116 |
| Decile 4 | 0.001149 |
| Decile 3 | 0.001137 |
| Decile 2 | 0.001125 |
| Decile 1 | 0.001107 |
| Minimum | 0.000675 |
|
|
- Mean = 0.00116606
- Std.dev = 5.31147e-05
- 21 items below graph minimum of 0.000984
- 517 items above graph maximum of 0.001353
|
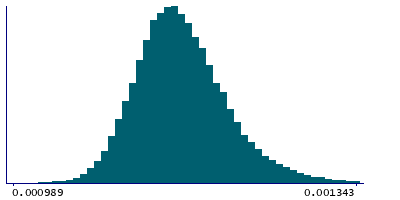
2 Instances
Instance 2 : Imaging visit (2014+)
79,153 participants, 79,153 items
| Maximum | 0.002148 |
| Decile 9 | 0.00123 |
| Decile 8 | 0.001203 |
| Decile 7 | 0.001186 |
| Decile 6 | 0.001172 |
| Median | 0.00116 |
| Decile 4 | 0.001149 |
| Decile 3 | 0.001138 |
| Decile 2 | 0.001125 |
| Decile 1 | 0.001107 |
| Minimum | 0.000675 |
|

|
- Mean = 0.00116627
- Std.dev = 5.34074e-05
- 18 items below graph minimum of 0.000984
- 501 items above graph maximum of 0.001353
|
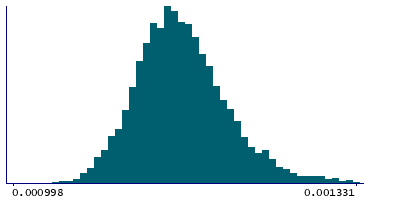
Instance 3 : First repeat imaging visit (2019+)
4,758 participants, 4,758 items
| Maximum | 0.001719 |
| Decile 9 | 0.00122 |
| Decile 8 | 0.001196 |
| Decile 7 | 0.001181 |
| Decile 6 | 0.001169 |
| Median | 0.001158 |
| Decile 4 | 0.001148 |
| Decile 3 | 0.001137 |
| Decile 2 | 0.001125 |
| Decile 1 | 0.001109 |
| Minimum | 0.000929 |
|
|
- Mean = 0.00116265
- Std.dev = 4.78549e-05
- 3 items below graph minimum of 0.000998
- 28 items above graph maximum of 0.001331
|
Notes
Mean L1 in superior corona radiata (right) on FA (fractional anisotropy) skeleton (from dMRI data)
0 Related Data-Fields
There are no related data-fields
2 Applications
| Application ID | Title |
|---|
| 17689 | Genetic, environmental and lifestyle predictors of brain/cognitive-related outcomes. |
| 22783 | The joint analysis of imaging data and genetic data for early tumor detection, prevention, diagnosis and treatment |

