Data
83,911 items of data are available, covering 79,384 participants.
Defined-instances run from 2 to 3, labelled using Instancing
2.
Units of measurement are AU.
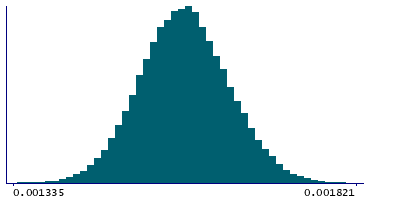
| Maximum | 0.002167 |
| Decile 9 | 0.001658 |
| Decile 8 | 0.001628 |
| Decile 7 | 0.001608 |
| Decile 6 | 0.001591 |
| Median | 0.001575 |
| Decile 4 | 0.001559 |
| Decile 3 | 0.001542 |
| Decile 2 | 0.001523 |
| Decile 1 | 0.001496 |
| Minimum | 0 |
|
|
- Mean = 0.00157553
- Std.dev = 6.51465e-05
- 91 items below graph minimum of 0.001334
- 22 items above graph maximum of 0.00182
|
2 Instances
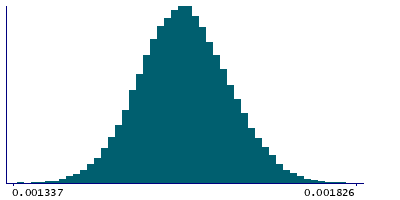
Instance 2 : Imaging visit (2014+)
79,153 participants, 79,153 items
| Maximum | 0.002167 |
| Decile 9 | 0.001659 |
| Decile 8 | 0.001629 |
| Decile 7 | 0.001609 |
| Decile 6 | 0.001591 |
| Median | 0.001576 |
| Decile 4 | 0.00156 |
| Decile 3 | 0.001543 |
| Decile 2 | 0.001524 |
| Decile 1 | 0.001496 |
| Minimum | 0 |
|
|
- Mean = 0.00157643
- Std.dev = 6.52934e-05
- 86 items below graph minimum of 0.001333
- 20 items above graph maximum of 0.001822
|
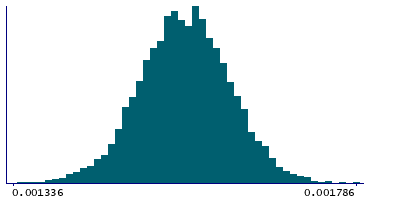
Instance 3 : First repeat imaging visit (2019+)
4,758 participants, 4,758 items
| Maximum | 0.002071 |
| Decile 9 | 0.001636 |
| Decile 8 | 0.00161 |
| Decile 7 | 0.001592 |
| Decile 6 | 0.001576 |
| Median | 0.001561 |
| Decile 4 | 0.001546 |
| Decile 3 | 0.001531 |
| Decile 2 | 0.0015115 |
| Decile 1 | 0.001486 |
| Minimum | 0.000933 |
|
|
- Mean = 0.0015606
- Std.dev = 6.07364e-05
- 5 items below graph minimum of 0.001336
- 4 items above graph maximum of 0.001786
|
Notes
Mean L1 in superior cerebellar peduncle (left) on FA (fractional anisotropy) skeleton (from dMRI data)
0 Related Data-Fields
There are no related data-fields
2 Applications
| Application ID | Title |
|---|
| 17689 | Genetic, environmental and lifestyle predictors of brain/cognitive-related outcomes. |
| 22783 | The joint analysis of imaging data and genetic data for early tumor detection, prevention, diagnosis and treatment |

