Data
83,911 items of data are available, covering 79,384 participants.
Defined-instances run from 2 to 3, labelled using Instancing
2.
Units of measurement are AU.
| Maximum | 0.002127 |
| Decile 9 | 0.001426 |
| Decile 8 | 0.001375 |
| Decile 7 | 0.001339 |
| Decile 6 | 0.001311 |
| Median | 0.001286 |
| Decile 4 | 0.001262 |
| Decile 3 | 0.001237 |
| Decile 2 | 0.00121 |
| Decile 1 | 0.001173 |
| Minimum | 0 |
|
|
- Mean = 0.00129461
- Std.dev = 0.000101695
- 8 items below graph minimum of 0.00092
- 158 items above graph maximum of 0.001679
|
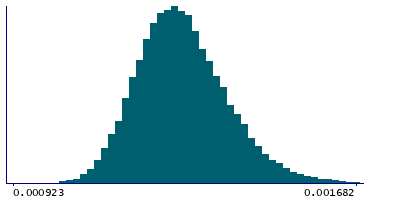
2 Instances
Instance 2 : Imaging visit (2014+)
79,153 participants, 79,153 items
| Maximum | 0.002127 |
| Decile 9 | 0.001426 |
| Decile 8 | 0.001374 |
| Decile 7 | 0.001339 |
| Decile 6 | 0.001311 |
| Median | 0.001286 |
| Decile 4 | 0.001262 |
| Decile 3 | 0.001237 |
| Decile 2 | 0.00121 |
| Decile 1 | 0.001174 |
| Minimum | 0 |
|

|
- Mean = 0.00129467
- Std.dev = 0.000101505
- 8 items below graph minimum of 0.000922
- 149 items above graph maximum of 0.001678
|
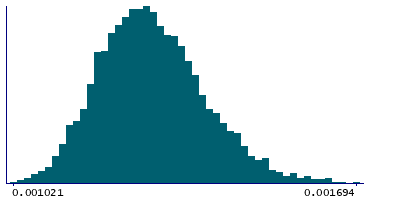
Instance 3 : First repeat imaging visit (2019+)
4,758 participants, 4,758 items
| Maximum | 0.001795 |
| Decile 9 | 0.001431 |
| Decile 8 | 0.001376 |
| Decile 7 | 0.001341 |
| Decile 6 | 0.001312 |
| Median | 0.001285 |
| Decile 4 | 0.0012595 |
| Decile 3 | 0.001233 |
| Decile 2 | 0.001204 |
| Decile 1 | 0.001168 |
| Minimum | 0.001021 |
|
|
- Mean = 0.00129362
- Std.dev = 0.000104788
- 9 items above graph maximum of 0.001694
|
Notes
Mean L1 in corticospinal tract (left) on FA (fractional anisotropy) skeleton (from dMRI data)
0 Related Data-Fields
There are no related data-fields
2 Applications
| Application ID | Title |
|---|
| 17689 | Genetic, environmental and lifestyle predictors of brain/cognitive-related outcomes. |
| 22783 | The joint analysis of imaging data and genetic data for early tumor detection, prevention, diagnosis and treatment |

