Data
83,911 items of data are available, covering 79,384 participants.
Defined-instances run from 2 to 3, labelled using Instancing
2.
Units of measurement are AU.
| Maximum | 0.002709 |
| Decile 9 | 0.00165 |
| Decile 8 | 0.001626 |
| Decile 7 | 0.001609 |
| Decile 6 | 0.001595 |
| Median | 0.001582 |
| Decile 4 | 0.001569 |
| Decile 3 | 0.001554 |
| Decile 2 | 0.001537 |
| Decile 1 | 0.001514 |
| Minimum | 0.000526 |
|

|
- Mean = 0.00158173
- Std.dev = 5.49509e-05
- 47 items below graph minimum of 0.001378
- 27 items above graph maximum of 0.001786
|
2 Instances
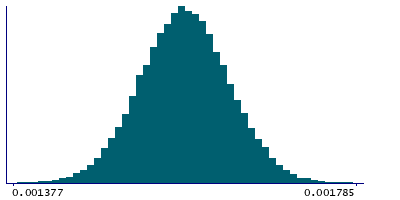
Instance 2 : Imaging visit (2014+)
79,153 participants, 79,153 items
| Maximum | 0.002709 |
| Decile 9 | 0.001651 |
| Decile 8 | 0.001626 |
| Decile 7 | 0.001609 |
| Decile 6 | 0.001595 |
| Median | 0.001582 |
| Decile 4 | 0.001569 |
| Decile 3 | 0.001554 |
| Decile 2 | 0.001537 |
| Decile 1 | 0.001514 |
| Minimum | 0.000526 |
|
|
- Mean = 0.00158195
- Std.dev = 5.51606e-05
- 44 items below graph minimum of 0.001377
- 25 items above graph maximum of 0.001788
|
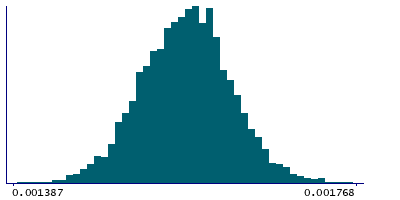
Instance 3 : First repeat imaging visit (2019+)
4,758 participants, 4,758 items
| Maximum | 0.001847 |
| Decile 9 | 0.001641 |
| Decile 8 | 0.001619 |
| Decile 7 | 0.001605 |
| Decile 6 | 0.001591 |
| Median | 0.00158 |
| Decile 4 | 0.001566 |
| Decile 3 | 0.001552 |
| Decile 2 | 0.001536 |
| Decile 1 | 0.001514 |
| Minimum | 0.001084 |
|
|
- Mean = 0.00157821
- Std.dev = 5.12081e-05
- 3 items below graph minimum of 0.001387
- 1 item above graph maximum of 0.001768
|
Notes
Mean L1 in genu of corpus callosum on FA (fractional anisotropy) skeleton (from dMRI data)
0 Related Data-Fields
There are no related data-fields
2 Applications
| Application ID | Title |
|---|
| 17689 | Genetic, environmental and lifestyle predictors of brain/cognitive-related outcomes. |
| 22783 | The joint analysis of imaging data and genetic data for early tumor detection, prevention, diagnosis and treatment |

