Data
83,911 items of data are available, covering 79,384 participants.
Defined-instances run from 2 to 3, labelled using Instancing
2.
Units of measurement are AU.
| Maximum | 0.001977 |
| Decile 9 | 0.001238 |
| Decile 8 | 0.001218 |
| Decile 7 | 0.001204 |
| Decile 6 | 0.001191 |
| Median | 0.00118 |
| Decile 4 | 0.001169 |
| Decile 3 | 0.001157 |
| Decile 2 | 0.001143 |
| Decile 1 | 0.001123 |
| Minimum | 0 |
|

|
- Mean = 0.0011805
- Std.dev = 4.60978e-05
- 34 items below graph minimum of 0.001008
- 46 items above graph maximum of 0.001353
|
2 Instances
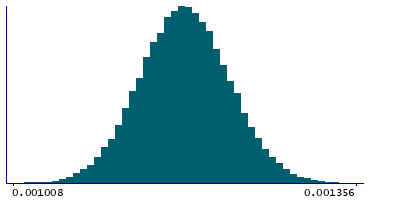
Instance 2 : Imaging visit (2014+)
79,153 participants, 79,153 items
| Maximum | 0.001977 |
| Decile 9 | 0.001239 |
| Decile 8 | 0.001219 |
| Decile 7 | 0.001205 |
| Decile 6 | 0.001192 |
| Median | 0.001181 |
| Decile 4 | 0.00117 |
| Decile 3 | 0.001158 |
| Decile 2 | 0.001144 |
| Decile 1 | 0.001125 |
| Minimum | 0 |
|
|
- Mean = 0.00118157
- Std.dev = 4.60241e-05
- 33 items below graph minimum of 0.001011
- 45 items above graph maximum of 0.001353
|
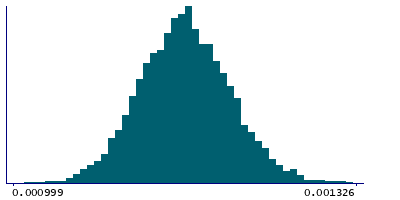
Instance 3 : First repeat imaging visit (2019+)
4,758 participants, 4,758 items
| Maximum | 0.001458 |
| Decile 9 | 0.001217 |
| Decile 8 | 0.001198 |
| Decile 7 | 0.001185 |
| Decile 6 | 0.001172 |
| Median | 0.001162 |
| Decile 4 | 0.0011515 |
| Decile 3 | 0.0011395 |
| Decile 2 | 0.001126 |
| Decile 1 | 0.001108 |
| Minimum | 0.000997 |
|
|
- Mean = 0.00116268
- Std.dev = 4.3604e-05
- 1 item below graph minimum of 0.000999
- 4 items above graph maximum of 0.001326
|
Notes
Mean L1 in middle cerebellar peduncle on FA (fractional anisotropy) skeleton (from dMRI data)
0 Related Data-Fields
There are no related data-fields
2 Applications
| Application ID | Title |
|---|
| 17689 | Genetic, environmental and lifestyle predictors of brain/cognitive-related outcomes. |
| 22783 | The joint analysis of imaging data and genetic data for early tumor detection, prevention, diagnosis and treatment |

