Data
83,911 items of data are available, covering 79,384 participants.
Defined-instances run from 2 to 3, labelled using Instancing
2.
Units of measurement are AU.
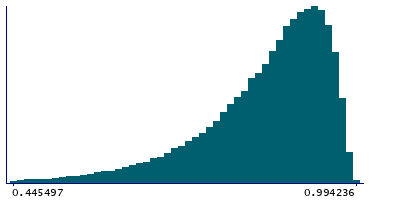
| Maximum | 0.994236 |
| Decile 9 | 0.950851 |
| Decile 8 | 0.930937 |
| Decile 7 | 0.911689 |
| Decile 6 | 0.89144 |
| Median | 0.869417 |
| Decile 4 | 0.843169 |
| Decile 3 | 0.810671 |
| Decile 2 | 0.766525 |
| Decile 1 | 0.692315 |
| Minimum | -0.524449 |
|
|
- Mean = 0.839752
- Std.dev = 0.115758
- 834 items below graph minimum of 0.43378
|
2 Instances
Instance 2 : Imaging visit (2014+)
79,153 participants, 79,153 items
| Maximum | 0.994236 |
| Decile 9 | 0.95107 |
| Decile 8 | 0.93113 |
| Decile 7 | 0.911948 |
| Decile 6 | 0.891729 |
| Median | 0.869703 |
| Decile 4 | 0.84353 |
| Decile 3 | 0.810945 |
| Decile 2 | 0.766755 |
| Decile 1 | 0.692512 |
| Minimum | -0.346882 |
|

|
- Mean = 0.839985
- Std.dev = 0.115793
- 790 items below graph minimum of 0.433955
|
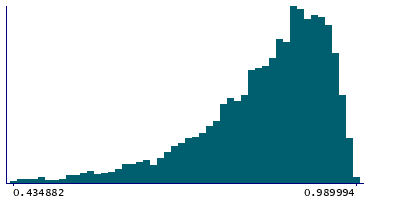
Instance 3 : First repeat imaging visit (2019+)
4,758 participants, 4,758 items
| Maximum | 0.989994 |
| Decile 9 | 0.948024 |
| Decile 8 | 0.927541 |
| Decile 7 | 0.906585 |
| Decile 6 | 0.887895 |
| Median | 0.864482 |
| Decile 4 | 0.837282 |
| Decile 3 | 0.805891 |
| Decile 2 | 0.763143 |
| Decile 1 | 0.691424 |
| Minimum | -0.524449 |
|
|
- Mean = 0.835863
- Std.dev = 0.115099
- 46 items below graph minimum of 0.434824
|
Notes
Mean MO (diffusion tensor mode) in tapetum (left) on FA (fractional anisotropy) skeleton (from dMRI data)
0 Related Data-Fields
There are no related data-fields
2 Applications
| Application ID | Title |
|---|
| 17689 | Genetic, environmental and lifestyle predictors of brain/cognitive-related outcomes. |
| 22783 | The joint analysis of imaging data and genetic data for early tumor detection, prevention, diagnosis and treatment |

