Data
83,911 items of data are available, covering 79,384 participants.
Defined-instances run from 2 to 3, labelled using Instancing
2.
Units of measurement are AU.
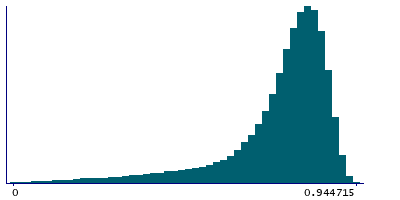
| Maximum | 0.950865 |
| Decile 9 | 0.863505 |
| Decile 8 | 0.838717 |
| Decile 7 | 0.817427 |
| Decile 6 | 0.795902 |
| Median | 0.7727 |
| Decile 4 | 0.745011 |
| Decile 3 | 0.706953 |
| Decile 2 | 0.642145 |
| Decile 1 | 0.497634 |
| Minimum | -0.311938 |
|
|
- Mean = 0.722476
- Std.dev = 0.163685
- 217 items below graph minimum of 0
|
2 Instances
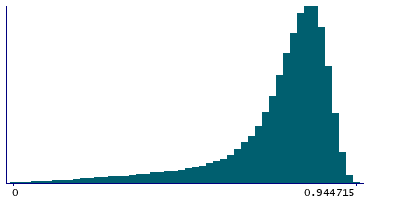
Instance 2 : Imaging visit (2014+)
79,153 participants, 79,153 items
| Maximum | 0.950865 |
| Decile 9 | 0.863707 |
| Decile 8 | 0.838964 |
| Decile 7 | 0.817654 |
| Decile 6 | 0.796119 |
| Median | 0.772748 |
| Decile 4 | 0.744869 |
| Decile 3 | 0.706568 |
| Decile 2 | 0.64132 |
| Decile 1 | 0.495594 |
| Minimum | -0.311938 |
|
|
- Mean = 0.722118
- Std.dev = 0.164423
- 211 items below graph minimum of 0
|
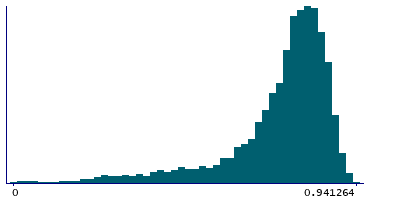
Instance 3 : First repeat imaging visit (2019+)
4,758 participants, 4,758 items
| Maximum | 0.941264 |
| Decile 9 | 0.860192 |
| Decile 8 | 0.834945 |
| Decile 7 | 0.814579 |
| Decile 6 | 0.792796 |
| Median | 0.772209 |
| Decile 4 | 0.746719 |
| Decile 3 | 0.711593 |
| Decile 2 | 0.657583 |
| Decile 1 | 0.525971 |
| Minimum | -0.291054 |
|
|
- Mean = 0.728431
- Std.dev = 0.150755
- 6 items below graph minimum of 0
|
Notes
Mean MO (diffusion tensor mode) in superior fronto-occipital fasciculus (left) on FA (fractional anisotropy) skeleton (from dMRI data)
0 Related Data-Fields
There are no related data-fields
2 Applications
| Application ID | Title |
|---|
| 17689 | Genetic, environmental and lifestyle predictors of brain/cognitive-related outcomes. |
| 22783 | The joint analysis of imaging data and genetic data for early tumor detection, prevention, diagnosis and treatment |

