Data
83,911 items of data are available, covering 79,384 participants.
Defined-instances run from 2 to 3, labelled using Instancing
2.
Units of measurement are AU.
| Maximum | 0.776709 |
| Decile 9 | 0.614984 |
| Decile 8 | 0.582523 |
| Decile 7 | 0.557441 |
| Decile 6 | 0.534319 |
| Median | 0.511892 |
| Decile 4 | 0.489077 |
| Decile 3 | 0.463432 |
| Decile 2 | 0.432657 |
| Decile 1 | 0.387501 |
| Minimum | -0.008625 |
|
|
- Mean = 0.505503
- Std.dev = 0.0888862
- 1 item below graph minimum of 0
|
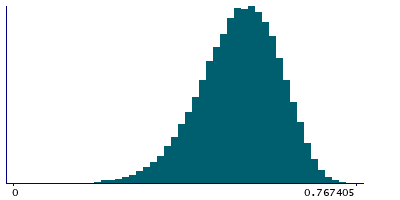
2 Instances
Instance 2 : Imaging visit (2014+)
79,153 participants, 79,153 items
| Maximum | 0.776709 |
| Decile 9 | 0.614951 |
| Decile 8 | 0.582654 |
| Decile 7 | 0.557497 |
| Decile 6 | 0.534366 |
| Median | 0.511929 |
| Decile 4 | 0.489136 |
| Decile 3 | 0.463557 |
| Decile 2 | 0.432617 |
| Decile 1 | 0.387296 |
| Minimum | 0.02594 |
|

|
- Mean = 0.505532
- Std.dev = 0.0888969
|
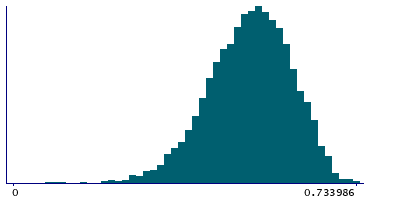
Instance 3 : First repeat imaging visit (2019+)
4,758 participants, 4,758 items
| Maximum | 0.733986 |
| Decile 9 | 0.615705 |
| Decile 8 | 0.58133 |
| Decile 7 | 0.556344 |
| Decile 6 | 0.533016 |
| Median | 0.511475 |
| Decile 4 | 0.48787 |
| Decile 3 | 0.461802 |
| Decile 2 | 0.43298 |
| Decile 1 | 0.390455 |
| Minimum | -0.008625 |
|
|
- Mean = 0.505022
- Std.dev = 0.0887075
- 1 item below graph minimum of 0
|
Notes
Mean MO (diffusion tensor mode) in superior longitudinal fasciculus (left) on FA (fractional anisotropy) skeleton (from dMRI data)
0 Related Data-Fields
There are no related data-fields
2 Applications
| Application ID | Title |
|---|
| 17689 | Genetic, environmental and lifestyle predictors of brain/cognitive-related outcomes. |
| 22783 | The joint analysis of imaging data and genetic data for early tumor detection, prevention, diagnosis and treatment |

