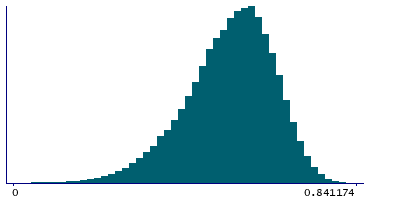
Data
83,911 items of data are available, covering 79,384 participants.
Defined-instances run from 2 to 3, labelled using Instancing
2.
Units of measurement are AU.
| Maximum | 0.841174 |
| Decile 9 | 0.65254 |
| Decile 8 | 0.615136 |
| Decile 7 | 0.586122 |
| Decile 6 | 0.559381 |
| Median | 0.532299 |
| Decile 4 | 0.503358 |
| Decile 3 | 0.471569 |
| Decile 2 | 0.430536 |
| Decile 1 | 0.3687 |
| Minimum | -0.171991 |
|
|
- Mean = 0.519882
- Std.dev = 0.112063
- 17 items below graph minimum of 0
|
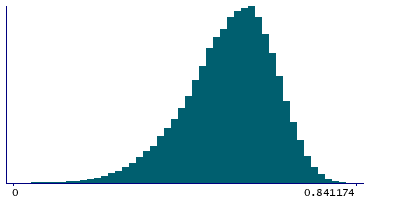
2 Instances
Instance 2 : Imaging visit (2014+)
79,153 participants, 79,153 items
| Maximum | 0.841174 |
| Decile 9 | 0.652022 |
| Decile 8 | 0.614416 |
| Decile 7 | 0.585314 |
| Decile 6 | 0.55845 |
| Median | 0.531205 |
| Decile 4 | 0.502272 |
| Decile 3 | 0.470388 |
| Decile 2 | 0.429172 |
| Decile 1 | 0.367298 |
| Minimum | -0.171991 |
|
|
- Mean = 0.518863
- Std.dev = 0.112384
- 17 items below graph minimum of 0
|
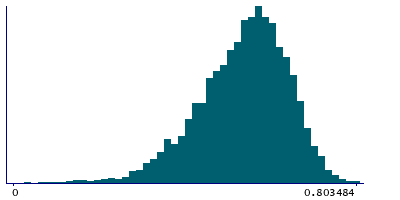
Instance 3 : First repeat imaging visit (2019+)
4,758 participants, 4,758 items
| Maximum | 0.803484 |
| Decile 9 | 0.660391 |
| Decile 8 | 0.625768 |
| Decile 7 | 0.59842 |
| Decile 6 | 0.574159 |
| Median | 0.549603 |
| Decile 4 | 0.523409 |
| Decile 3 | 0.492014 |
| Decile 2 | 0.454342 |
| Decile 1 | 0.397706 |
| Minimum | 0.028612 |
|
|
- Mean = 0.536826
- Std.dev = 0.105143
|
Notes
Mean MO (diffusion tensor mode) in fornix cres+stria terminalis (left) on FA (fractional anisotropy) skeleton (from dMRI data)
0 Related Data-Fields
There are no related data-fields
2 Applications
| Application ID | Title |
|---|
| 17689 | Genetic, environmental and lifestyle predictors of brain/cognitive-related outcomes. |
| 22783 | The joint analysis of imaging data and genetic data for early tumor detection, prevention, diagnosis and treatment |

