Data
83,911 items of data are available, covering 79,384 participants.
Defined-instances run from 2 to 3, labelled using Instancing
2.
Units of measurement are AU.
| Maximum | 0.87467 |
| Decile 9 | 0.740517 |
| Decile 8 | 0.708649 |
| Decile 7 | 0.683791 |
| Decile 6 | 0.661537 |
| Median | 0.638407 |
| Decile 4 | 0.614329 |
| Decile 3 | 0.586782 |
| Decile 2 | 0.552129 |
| Decile 1 | 0.500649 |
| Minimum | -0.130762 |
|

|
- Mean = 0.627343
- Std.dev = 0.0962883
- 190 items below graph minimum of 0.260781
|
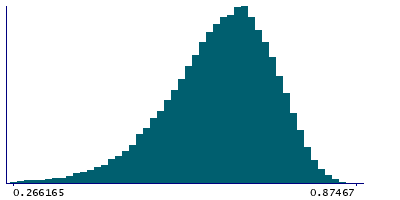
2 Instances
Instance 2 : Imaging visit (2014+)
79,153 participants, 79,153 items
| Maximum | 0.87467 |
| Decile 9 | 0.74005 |
| Decile 8 | 0.708068 |
| Decile 7 | 0.683015 |
| Decile 6 | 0.660849 |
| Median | 0.637725 |
| Decile 4 | 0.613628 |
| Decile 3 | 0.586002 |
| Decile 2 | 0.551319 |
| Decile 1 | 0.499903 |
| Minimum | -0.130762 |
|
|
- Mean = 0.626668
- Std.dev = 0.0962935
- 173 items below graph minimum of 0.259756
|
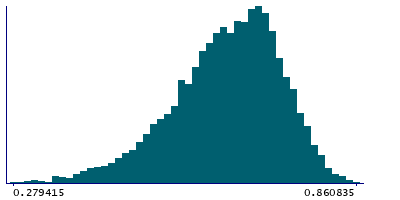
Instance 3 : First repeat imaging visit (2019+)
4,758 participants, 4,758 items
| Maximum | 0.860835 |
| Decile 9 | 0.748659 |
| Decile 8 | 0.717807 |
| Decile 7 | 0.695929 |
| Decile 6 | 0.674165 |
| Median | 0.649583 |
| Decile 4 | 0.6256 |
| Decile 3 | 0.599427 |
| Decile 2 | 0.565352 |
| Decile 1 | 0.513908 |
| Minimum | -0.049555 |
|
|
- Mean = 0.63858
- Std.dev = 0.0955038
- 13 items below graph minimum of 0.279157
|
Notes
Mean MO (diffusion tensor mode) in cingulum hippocampus (left) on FA (fractional anisotropy) skeleton (from dMRI data)
0 Related Data-Fields
There are no related data-fields
2 Applications
| Application ID | Title |
|---|
| 17689 | Genetic, environmental and lifestyle predictors of brain/cognitive-related outcomes. |
| 22783 | The joint analysis of imaging data and genetic data for early tumor detection, prevention, diagnosis and treatment |

