Data
83,911 items of data are available, covering 79,384 participants.
Defined-instances run from 2 to 3, labelled using Instancing
2.
Units of measurement are AU.
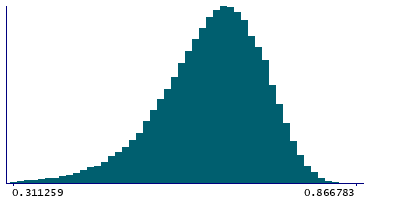
| Maximum | 0.866783 |
| Decile 9 | 0.727912 |
| Decile 8 | 0.700103 |
| Decile 7 | 0.677628 |
| Decile 6 | 0.657448 |
| Median | 0.637355 |
| Decile 4 | 0.616139 |
| Decile 3 | 0.592207 |
| Decile 2 | 0.561972 |
| Decile 1 | 0.515577 |
| Minimum | 0 |
|
|
- Mean = 0.627687
- Std.dev = 0.0859047
- 211 items below graph minimum of 0.303242
|
2 Instances
Instance 2 : Imaging visit (2014+)
79,153 participants, 79,153 items
| Maximum | 0.866783 |
| Decile 9 | 0.727529 |
| Decile 8 | 0.699536 |
| Decile 7 | 0.677118 |
| Decile 6 | 0.656931 |
| Median | 0.636623 |
| Decile 4 | 0.615391 |
| Decile 3 | 0.591307 |
| Decile 2 | 0.560863 |
| Decile 1 | 0.514597 |
| Minimum | 0 |
|

|
- Mean = 0.626977
- Std.dev = 0.086131
- 192 items below graph minimum of 0.301665
|
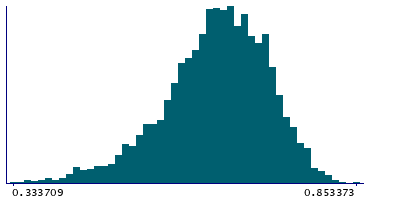
Instance 3 : First repeat imaging visit (2019+)
4,758 participants, 4,758 items
| Maximum | 0.853373 |
| Decile 9 | 0.732916 |
| Decile 8 | 0.708174 |
| Decile 7 | 0.686196 |
| Decile 6 | 0.665594 |
| Median | 0.647179 |
| Decile 4 | 0.629005 |
| Decile 3 | 0.606541 |
| Decile 2 | 0.57953 |
| Decile 1 | 0.533214 |
| Minimum | 0.001175 |
|
|
- Mean = 0.639492
- Std.dev = 0.081142
- 12 items below graph minimum of 0.333511
|
Notes
Mean MO (diffusion tensor mode) in cingulum hippocampus (right) on FA (fractional anisotropy) skeleton (from dMRI data)
0 Related Data-Fields
There are no related data-fields
2 Applications
| Application ID | Title |
|---|
| 17689 | Genetic, environmental and lifestyle predictors of brain/cognitive-related outcomes. |
| 22783 | The joint analysis of imaging data and genetic data for early tumor detection, prevention, diagnosis and treatment |

