Data
83,911 items of data are available, covering 79,384 participants.
Defined-instances run from 2 to 3, labelled using Instancing
2.
Units of measurement are AU.
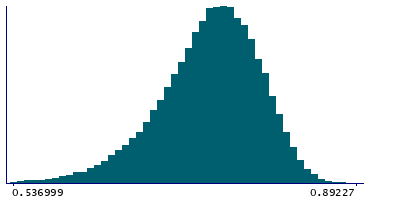
| Maximum | 0.89227 |
| Decile 9 | 0.800326 |
| Decile 8 | 0.782188 |
| Decile 7 | 0.768136 |
| Decile 6 | 0.755478 |
| Median | 0.742991 |
| Decile 4 | 0.729936 |
| Decile 3 | 0.714895 |
| Decile 2 | 0.695856 |
| Decile 1 | 0.666031 |
| Minimum | -0.010882 |
|

|
- Mean = 0.736865
- Std.dev = 0.0552393
- 246 items below graph minimum of 0.531737
|
2 Instances
Instance 2 : Imaging visit (2014+)
79,153 participants, 79,153 items
| Maximum | 0.89227 |
| Decile 9 | 0.800154 |
| Decile 8 | 0.781946 |
| Decile 7 | 0.767881 |
| Decile 6 | 0.755267 |
| Median | 0.742709 |
| Decile 4 | 0.72968 |
| Decile 3 | 0.714559 |
| Decile 2 | 0.695499 |
| Decile 1 | 0.665638 |
| Minimum | -0.010882 |
|
|
- Mean = 0.736594
- Std.dev = 0.0553018
- 232 items below graph minimum of 0.531121
|
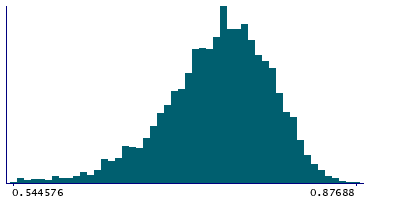
Instance 3 : First repeat imaging visit (2019+)
4,758 participants, 4,758 items
| Maximum | 0.87688 |
| Decile 9 | 0.803401 |
| Decile 8 | 0.786086 |
| Decile 7 | 0.771391 |
| Decile 6 | 0.759486 |
| Median | 0.747423 |
| Decile 4 | 0.734041 |
| Decile 3 | 0.719914 |
| Decile 2 | 0.701611 |
| Decile 1 | 0.674009 |
| Minimum | 0.144871 |
|
|
- Mean = 0.741373
- Std.dev = 0.0539888
- 13 items below graph minimum of 0.544616
|
Notes
Mean MO (diffusion tensor mode) in cingulum cingulate gyrus (left) on FA (fractional anisotropy) skeleton (from dMRI data)
0 Related Data-Fields
There are no related data-fields
2 Applications
| Application ID | Title |
|---|
| 17689 | Genetic, environmental and lifestyle predictors of brain/cognitive-related outcomes. |
| 22783 | The joint analysis of imaging data and genetic data for early tumor detection, prevention, diagnosis and treatment |

