Data
83,911 items of data are available, covering 79,384 participants.
Defined-instances run from 2 to 3, labelled using Instancing
2.
Units of measurement are AU.
| Maximum | 0.894402 |
| Decile 9 | 0.766814 |
| Decile 8 | 0.744223 |
| Decile 7 | 0.726411 |
| Decile 6 | 0.71019 |
| Median | 0.693817 |
| Decile 4 | 0.677035 |
| Decile 3 | 0.657224 |
| Decile 2 | 0.632945 |
| Decile 1 | 0.597053 |
| Minimum | 0.02434 |
|
|
- Mean = 0.686271
- Std.dev = 0.0691596
- 218 items below graph minimum of 0.427292
|
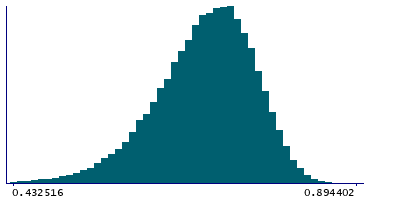
2 Instances
Instance 2 : Imaging visit (2014+)
79,153 participants, 79,153 items
| Maximum | 0.894402 |
| Decile 9 | 0.766569 |
| Decile 8 | 0.743848 |
| Decile 7 | 0.726144 |
| Decile 6 | 0.709841 |
| Median | 0.693477 |
| Decile 4 | 0.676735 |
| Decile 3 | 0.656908 |
| Decile 2 | 0.632502 |
| Decile 1 | 0.596476 |
| Minimum | 0.02434 |
|

|
- Mean = 0.685881
- Std.dev = 0.069294
- 206 items below graph minimum of 0.426383
|
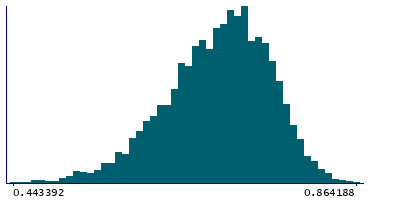
Instance 3 : First repeat imaging visit (2019+)
4,758 participants, 4,758 items
| Maximum | 0.864188 |
| Decile 9 | 0.769946 |
| Decile 8 | 0.749468 |
| Decile 7 | 0.730738 |
| Decile 6 | 0.715935 |
| Median | 0.700317 |
| Decile 4 | 0.682573 |
| Decile 3 | 0.6642 |
| Decile 2 | 0.641293 |
| Decile 1 | 0.606641 |
| Minimum | 0.083333 |
|
|
- Mean = 0.692764
- Std.dev = 0.0665486
- 13 items below graph minimum of 0.443335
|
Notes
Mean MO (diffusion tensor mode) in cingulum cingulate gyrus (right) on FA (fractional anisotropy) skeleton (from dMRI data)
0 Related Data-Fields
There are no related data-fields
2 Applications
| Application ID | Title |
|---|
| 17689 | Genetic, environmental and lifestyle predictors of brain/cognitive-related outcomes. |
| 22783 | The joint analysis of imaging data and genetic data for early tumor detection, prevention, diagnosis and treatment |

