Data
83,911 items of data are available, covering 79,384 participants.
Defined-instances run from 2 to 3, labelled using Instancing
2.
Units of measurement are AU.
| Maximum | 0.700259 |
| Decile 9 | 0.536195 |
| Decile 8 | 0.507964 |
| Decile 7 | 0.487333 |
| Decile 6 | 0.468863 |
| Median | 0.451222 |
| Decile 4 | 0.433195 |
| Decile 3 | 0.413883 |
| Decile 2 | 0.390072 |
| Decile 1 | 0.35655 |
| Minimum | -0.037999 |
|
|
- Mean = 0.448159
- Std.dev = 0.0704537
- 1 item below graph minimum of 0
|
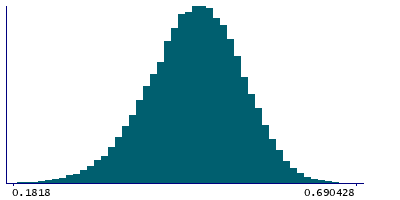
2 Instances
Instance 2 : Imaging visit (2014+)
79,153 participants, 79,153 items
| Maximum | 0.700259 |
| Decile 9 | 0.535844 |
| Decile 8 | 0.507637 |
| Decile 7 | 0.487006 |
| Decile 6 | 0.468552 |
| Median | 0.450836 |
| Decile 4 | 0.432725 |
| Decile 3 | 0.413314 |
| Decile 2 | 0.389482 |
| Decile 1 | 0.355812 |
| Minimum | 0 |
|

|
- Mean = 0.447701
- Std.dev = 0.0705221
|
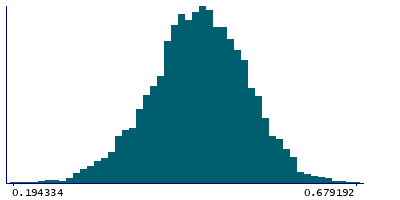
Instance 3 : First repeat imaging visit (2019+)
4,758 participants, 4,758 items
| Maximum | 0.679192 |
| Decile 9 | 0.541191 |
| Decile 8 | 0.513942 |
| Decile 7 | 0.493166 |
| Decile 6 | 0.4743 |
| Median | 0.457752 |
| Decile 4 | 0.440137 |
| Decile 3 | 0.422052 |
| Decile 2 | 0.400953 |
| Decile 1 | 0.367672 |
| Minimum | -0.037999 |
|
|
- Mean = 0.455786
- Std.dev = 0.0688584
- 4 items below graph minimum of 0.194153
|
Notes
Mean MO (diffusion tensor mode) in external capsule (right) on FA (fractional anisotropy) skeleton (from dMRI data)
0 Related Data-Fields
There are no related data-fields
2 Applications
| Application ID | Title |
|---|
| 17689 | Genetic, environmental and lifestyle predictors of brain/cognitive-related outcomes. |
| 22783 | The joint analysis of imaging data and genetic data for early tumor detection, prevention, diagnosis and treatment |

