Data
83,911 items of data are available, covering 79,384 participants.
Defined-instances run from 2 to 3, labelled using Instancing
2.
Units of measurement are AU.
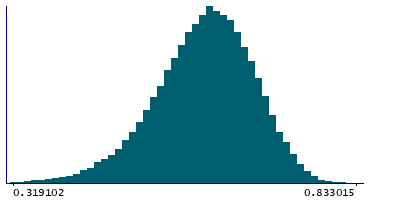
| Maximum | 0.833015 |
| Decile 9 | 0.694244 |
| Decile 8 | 0.666848 |
| Decile 7 | 0.645889 |
| Decile 6 | 0.627561 |
| Median | 0.609686 |
| Decile 4 | 0.591084 |
| Decile 3 | 0.570112 |
| Decile 2 | 0.544541 |
| Decile 1 | 0.506216 |
| Minimum | -0.093404 |
|
|
- Mean = 0.603579
- Std.dev = 0.0753098
- 153 items below graph minimum of 0.318188
|
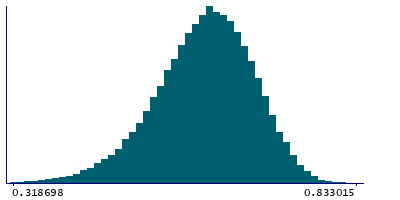
2 Instances
Instance 2 : Imaging visit (2014+)
79,153 participants, 79,153 items
| Maximum | 0.833015 |
| Decile 9 | 0.694112 |
| Decile 8 | 0.666845 |
| Decile 7 | 0.645875 |
| Decile 6 | 0.627518 |
| Median | 0.609581 |
| Decile 4 | 0.59105 |
| Decile 3 | 0.57001 |
| Decile 2 | 0.544422 |
| Decile 1 | 0.505985 |
| Minimum | -0.093404 |
|
|
- Mean = 0.603471
- Std.dev = 0.0753958
- 149 items below graph minimum of 0.317857
|
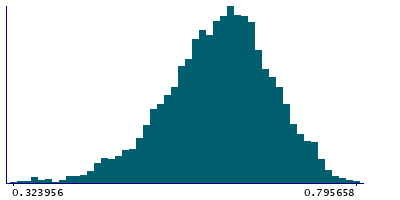
Instance 3 : First repeat imaging visit (2019+)
4,758 participants, 4,758 items
| Maximum | 0.795658 |
| Decile 9 | 0.696075 |
| Decile 8 | 0.666948 |
| Decile 7 | 0.646146 |
| Decile 6 | 0.628121 |
| Median | 0.610705 |
| Decile 4 | 0.591642 |
| Decile 3 | 0.572281 |
| Decile 2 | 0.546493 |
| Decile 1 | 0.510002 |
| Minimum | 0.188096 |
|
|
- Mean = 0.60538
- Std.dev = 0.0738422
- 3 items below graph minimum of 0.323929
|
Notes
Mean MO (diffusion tensor mode) in sagittal stratum (left) on FA (fractional anisotropy) skeleton (from dMRI data)
0 Related Data-Fields
There are no related data-fields
2 Applications
| Application ID | Title |
|---|
| 17689 | Genetic, environmental and lifestyle predictors of brain/cognitive-related outcomes. |
| 22783 | The joint analysis of imaging data and genetic data for early tumor detection, prevention, diagnosis and treatment |

