Data
83,911 items of data are available, covering 79,384 participants.
Defined-instances run from 2 to 3, labelled using Instancing
2.
Units of measurement are AU.
| Maximum | 0.869511 |
| Decile 9 | 0.715549 |
| Decile 8 | 0.687335 |
| Decile 7 | 0.66529 |
| Decile 6 | 0.64562 |
| Median | 0.626143 |
| Decile 4 | 0.606272 |
| Decile 3 | 0.584041 |
| Decile 2 | 0.556051 |
| Decile 1 | 0.515714 |
| Minimum | -0.359146 |
|
|
- Mean = 0.619843
- Std.dev = 0.0792558
- 121 items below graph minimum of 0.315879
|
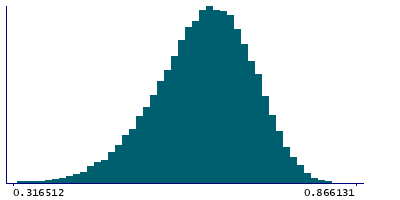
2 Instances
Instance 2 : Imaging visit (2014+)
79,153 participants, 79,153 items
| Maximum | 0.869511 |
| Decile 9 | 0.715395 |
| Decile 8 | 0.687148 |
| Decile 7 | 0.665073 |
| Decile 6 | 0.645454 |
| Median | 0.625938 |
| Decile 4 | 0.606059 |
| Decile 3 | 0.583727 |
| Decile 2 | 0.555782 |
| Decile 1 | 0.515487 |
| Minimum | -0.359146 |
|

|
- Mean = 0.619605
- Std.dev = 0.0793389
- 113 items below graph minimum of 0.31558
|
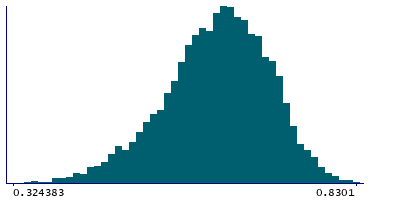
Instance 3 : First repeat imaging visit (2019+)
4,758 participants, 4,758 items
| Maximum | 0.8301 |
| Decile 9 | 0.71778 |
| Decile 8 | 0.690461 |
| Decile 7 | 0.668642 |
| Decile 6 | 0.648351 |
| Median | 0.630126 |
| Decile 4 | 0.610046 |
| Decile 3 | 0.588445 |
| Decile 2 | 0.562228 |
| Decile 1 | 0.521101 |
| Minimum | 0.072707 |
|
|
- Mean = 0.623808
- Std.dev = 0.077752
- 6 items below graph minimum of 0.324423
|
Notes
Mean MO (diffusion tensor mode) in sagittal stratum (right) on FA (fractional anisotropy) skeleton (from dMRI data)
0 Related Data-Fields
There are no related data-fields
2 Applications
| Application ID | Title |
|---|
| 17689 | Genetic, environmental and lifestyle predictors of brain/cognitive-related outcomes. |
| 22783 | The joint analysis of imaging data and genetic data for early tumor detection, prevention, diagnosis and treatment |

