Data
83,911 items of data are available, covering 79,384 participants.
Defined-instances run from 2 to 3, labelled using Instancing
2.
Units of measurement are AU.
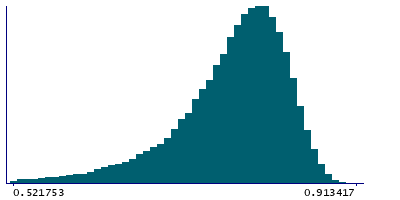
| Maximum | 0.913417 |
| Decile 9 | 0.838146 |
| Decile 8 | 0.821573 |
| Decile 7 | 0.807846 |
| Decile 6 | 0.794569 |
| Median | 0.780909 |
| Decile 4 | 0.765553 |
| Decile 3 | 0.746703 |
| Decile 2 | 0.720527 |
| Decile 1 | 0.674465 |
| Minimum | -0.094152 |
|

|
- Mean = 0.765385
- Std.dev = 0.0731769
- 902 items below graph minimum of 0.510783
|
2 Instances
Instance 2 : Imaging visit (2014+)
79,153 participants, 79,153 items
| Maximum | 0.913417 |
| Decile 9 | 0.838083 |
| Decile 8 | 0.821452 |
| Decile 7 | 0.807721 |
| Decile 6 | 0.794408 |
| Median | 0.780682 |
| Decile 4 | 0.765217 |
| Decile 3 | 0.746295 |
| Decile 2 | 0.719897 |
| Decile 1 | 0.67349 |
| Minimum | -0.094152 |
|
|
- Mean = 0.765032
- Std.dev = 0.0734935
- 852 items below graph minimum of 0.508897
|
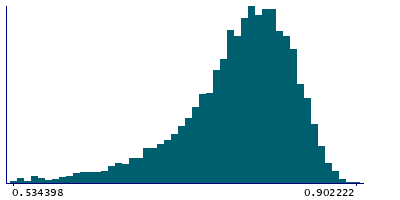
Instance 3 : First repeat imaging visit (2019+)
4,758 participants, 4,758 items
| Maximum | 0.902222 |
| Decile 9 | 0.840108 |
| Decile 8 | 0.823611 |
| Decile 7 | 0.809928 |
| Decile 6 | 0.797063 |
| Median | 0.784298 |
| Decile 4 | 0.770001 |
| Decile 3 | 0.753794 |
| Decile 2 | 0.729365 |
| Decile 1 | 0.687173 |
| Minimum | 0.058611 |
|
|
- Mean = 0.771268
- Std.dev = 0.067422
- 47 items below graph minimum of 0.534239
|
Notes
Mean MO (diffusion tensor mode) in posterior thalamic radiation (left) on FA (fractional anisotropy) skeleton (from dMRI data)
0 Related Data-Fields
There are no related data-fields
2 Applications
| Application ID | Title |
|---|
| 17689 | Genetic, environmental and lifestyle predictors of brain/cognitive-related outcomes. |
| 22783 | The joint analysis of imaging data and genetic data for early tumor detection, prevention, diagnosis and treatment |

