Data
83,911 items of data are available, covering 79,384 participants.
Defined-instances run from 2 to 3, labelled using Instancing
2.
Units of measurement are AU.
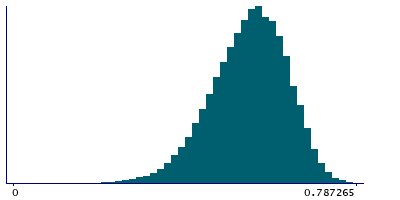
| Maximum | 0.802405 |
| Decile 9 | 0.64817 |
| Decile 8 | 0.616973 |
| Decile 7 | 0.592821 |
| Decile 6 | 0.570562 |
| Median | 0.549483 |
| Decile 4 | 0.527423 |
| Decile 3 | 0.502247 |
| Decile 2 | 0.471752 |
| Decile 1 | 0.428293 |
| Minimum | -0.010386 |
|
|
- Mean = 0.542727
- Std.dev = 0.0862015
- 1 item below graph minimum of 0
|
2 Instances
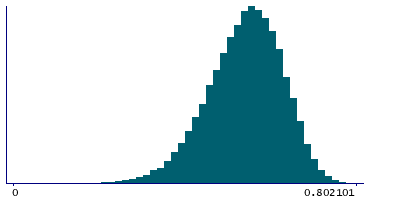
Instance 2 : Imaging visit (2014+)
79,153 participants, 79,153 items
| Maximum | 0.802405 |
| Decile 9 | 0.648436 |
| Decile 8 | 0.61715 |
| Decile 7 | 0.593036 |
| Decile 6 | 0.570806 |
| Median | 0.549727 |
| Decile 4 | 0.527704 |
| Decile 3 | 0.502535 |
| Decile 2 | 0.471919 |
| Decile 1 | 0.428492 |
| Minimum | 0.08005 |
|
|
- Mean = 0.542952
- Std.dev = 0.0862182
|
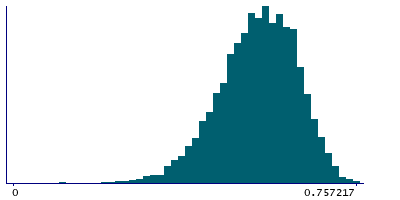
Instance 3 : First repeat imaging visit (2019+)
4,758 participants, 4,758 items
| Maximum | 0.757217 |
| Decile 9 | 0.643607 |
| Decile 8 | 0.614039 |
| Decile 7 | 0.59007 |
| Decile 6 | 0.566686 |
| Median | 0.54536 |
| Decile 4 | 0.523068 |
| Decile 3 | 0.497924 |
| Decile 2 | 0.469351 |
| Decile 1 | 0.42542 |
| Minimum | -0.010386 |
|
|
- Mean = 0.538995
- Std.dev = 0.0858373
- 1 item below graph minimum of 0
|
Notes
Mean MO (diffusion tensor mode) in posterior corona radiata (left) on FA (fractional anisotropy) skeleton (from dMRI data)
0 Related Data-Fields
There are no related data-fields
2 Applications
| Application ID | Title |
|---|
| 17689 | Genetic, environmental and lifestyle predictors of brain/cognitive-related outcomes. |
| 22783 | The joint analysis of imaging data and genetic data for early tumor detection, prevention, diagnosis and treatment |

