Data
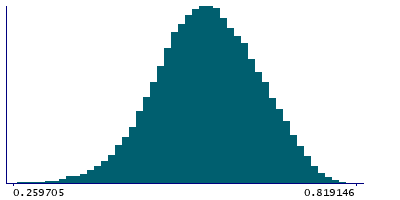
83,911 items of data are available, covering 79,384 participants.
Defined-instances run from 2 to 3, labelled using Instancing
2.
Units of measurement are AU.
| Maximum | 0.819146 |
| Decile 9 | 0.680904 |
| Decile 8 | 0.645673 |
| Decile 7 | 0.619172 |
| Decile 6 | 0.596252 |
| Median | 0.575287 |
| Decile 4 | 0.55448 |
| Decile 3 | 0.532914 |
| Decile 2 | 0.507644 |
| Decile 1 | 0.472101 |
| Minimum | -0.000403 |
|

|
- Mean = 0.575099
- Std.dev = 0.0811398
- 45 items below graph minimum of 0.263297
|
2 Instances
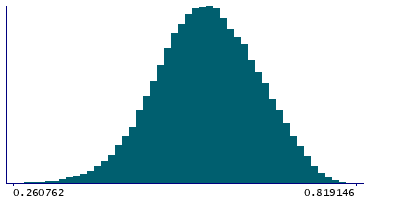
Instance 2 : Imaging visit (2014+)
79,153 participants, 79,153 items
| Maximum | 0.819146 |
| Decile 9 | 0.680685 |
| Decile 8 | 0.645579 |
| Decile 7 | 0.619116 |
| Decile 6 | 0.596179 |
| Median | 0.575303 |
| Decile 4 | 0.554566 |
| Decile 3 | 0.533106 |
| Decile 2 | 0.507926 |
| Decile 1 | 0.472532 |
| Minimum | -0.000403 |
|

|
- Mean = 0.575215
- Std.dev = 0.080879
- 40 items below graph minimum of 0.264379
|
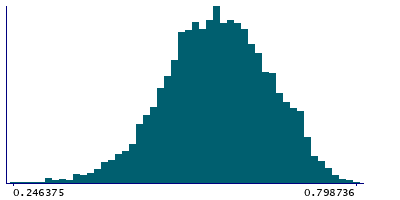
Instance 3 : First repeat imaging visit (2019+)
4,758 participants, 4,758 items
| Maximum | 0.798736 |
| Decile 9 | 0.683574 |
| Decile 8 | 0.647278 |
| Decile 7 | 0.620372 |
| Decile 6 | 0.597526 |
| Median | 0.574587 |
| Decile 4 | 0.552827 |
| Decile 3 | 0.529062 |
| Decile 2 | 0.50398 |
| Decile 1 | 0.464898 |
| Minimum | 0.081187 |
|

|
- Mean = 0.573156
- Std.dev = 0.0853392
- 3 items below graph minimum of 0.246222
|
Notes
Mean MO (diffusion tensor mode) in anterior corona radiata (left) on FA (fractional anisotropy) skeleton (from dMRI data)
0 Related Data-Fields
There are no related data-fields
2 Applications
| Application ID | Title |
|---|
| 17689 | Genetic, environmental and lifestyle predictors of brain/cognitive-related outcomes. |
| 22783 | The joint analysis of imaging data and genetic data for early tumor detection, prevention, diagnosis and treatment |


