Data
83,911 items of data are available, covering 79,384 participants.
Defined-instances run from 2 to 3, labelled using Instancing
2.
Units of measurement are AU.
| Maximum | 0.94079 |
| Decile 9 | 0.892297 |
| Decile 8 | 0.879566 |
| Decile 7 | 0.868918 |
| Decile 6 | 0.859164 |
| Median | 0.849437 |
| Decile 4 | 0.838726 |
| Decile 3 | 0.826535 |
| Decile 2 | 0.810949 |
| Decile 1 | 0.786691 |
| Minimum | -0.020926 |
|

|
- Mean = 0.843213
- Std.dev = 0.0443884
- 289 items below graph minimum of 0.681086
|
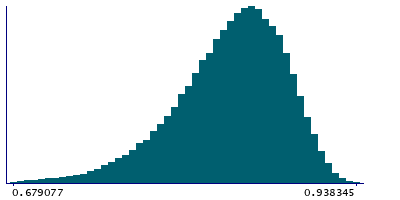
2 Instances
Instance 2 : Imaging visit (2014+)
79,153 participants, 79,153 items
| Maximum | 0.94079 |
| Decile 9 | 0.892459 |
| Decile 8 | 0.879735 |
| Decile 7 | 0.869082 |
| Decile 6 | 0.859317 |
| Median | 0.84956 |
| Decile 4 | 0.838793 |
| Decile 3 | 0.826626 |
| Decile 2 | 0.810989 |
| Decile 1 | 0.78675 |
| Minimum | -0.020926 |
|
|
- Mean = 0.843338
- Std.dev = 0.0443224
- 266 items below graph minimum of 0.681041
|
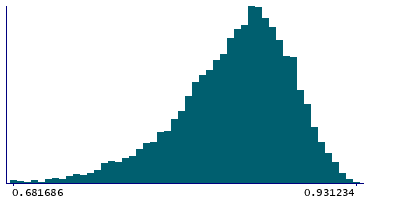
Instance 3 : First repeat imaging visit (2019+)
4,758 participants, 4,758 items
| Maximum | 0.931234 |
| Decile 9 | 0.889246 |
| Decile 8 | 0.876561 |
| Decile 7 | 0.866394 |
| Decile 6 | 0.857272 |
| Median | 0.848042 |
| Decile 4 | 0.837751 |
| Decile 3 | 0.825069 |
| Decile 2 | 0.810096 |
| Decile 1 | 0.785611 |
| Minimum | 0.137503 |
|
|
- Mean = 0.841143
- Std.dev = 0.0454216
- 23 items below graph minimum of 0.681977
|
Notes
Mean MO (diffusion tensor mode) in posterior limb of internal capsule (right) on FA (fractional anisotropy) skeleton (from dMRI data)
0 Related Data-Fields
There are no related data-fields
2 Applications
| Application ID | Title |
|---|
| 17689 | Genetic, environmental and lifestyle predictors of brain/cognitive-related outcomes. |
| 22783 | The joint analysis of imaging data and genetic data for early tumor detection, prevention, diagnosis and treatment |

