Data
83,911 items of data are available, covering 79,384 participants.
Defined-instances run from 2 to 3, labelled using Instancing
2.
Units of measurement are AU.
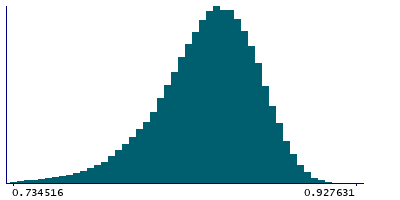
| Maximum | 0.927631 |
| Decile 9 | 0.875784 |
| Decile 8 | 0.86625 |
| Decile 7 | 0.858728 |
| Decile 6 | 0.851921 |
| Median | 0.845274 |
| Decile 4 | 0.838292 |
| Decile 3 | 0.83024 |
| Decile 2 | 0.820148 |
| Decile 1 | 0.804248 |
| Minimum | -0.097928 |
|
|
- Mean = 0.841767
- Std.dev = 0.0320078
- 315 items below graph minimum of 0.732711
|
2 Instances
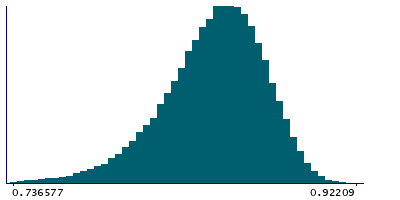
Instance 2 : Imaging visit (2014+)
79,153 participants, 79,153 items
| Maximum | 0.927631 |
| Decile 9 | 0.875736 |
| Decile 8 | 0.866153 |
| Decile 7 | 0.858636 |
| Decile 6 | 0.8518 |
| Median | 0.845141 |
| Decile 4 | 0.838083 |
| Decile 3 | 0.830056 |
| Decile 2 | 0.819854 |
| Decile 1 | 0.80387 |
| Minimum | -0.097928 |
|
|
- Mean = 0.841597
- Std.dev = 0.0319335
- 289 items below graph minimum of 0.732005
|
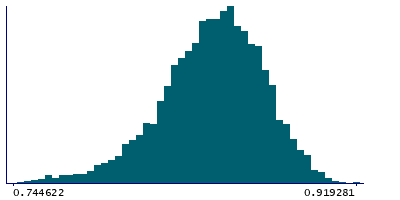
Instance 3 : First repeat imaging visit (2019+)
4,758 participants, 4,758 items
| Maximum | 0.919281 |
| Decile 9 | 0.876521 |
| Decile 8 | 0.867783 |
| Decile 7 | 0.860347 |
| Decile 6 | 0.854 |
| Median | 0.847796 |
| Decile 4 | 0.841007 |
| Decile 3 | 0.833485 |
| Decile 2 | 0.824989 |
| Decile 1 | 0.810553 |
| Minimum | 0.018379 |
|
|
- Mean = 0.844593
- Std.dev = 0.0330906
- 22 items below graph minimum of 0.744586
|
Notes
Mean MO (diffusion tensor mode) in cerebral peduncle (right) on FA (fractional anisotropy) skeleton (from dMRI data)
0 Related Data-Fields
There are no related data-fields
2 Applications
| Application ID | Title |
|---|
| 17689 | Genetic, environmental and lifestyle predictors of brain/cognitive-related outcomes. |
| 22783 | The joint analysis of imaging data and genetic data for early tumor detection, prevention, diagnosis and treatment |

