Data
83,911 items of data are available, covering 79,384 participants.
Defined-instances run from 2 to 3, labelled using Instancing
2.
Units of measurement are AU.
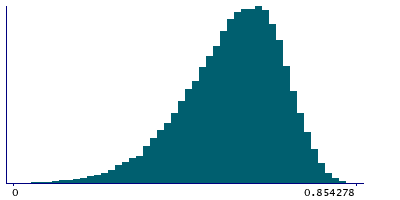
| Maximum | 0.854278 |
| Decile 9 | 0.68684 |
| Decile 8 | 0.648367 |
| Decile 7 | 0.61764 |
| Decile 6 | 0.58803 |
| Median | 0.557922 |
| Decile 4 | 0.526207 |
| Decile 3 | 0.489563 |
| Decile 2 | 0.443569 |
| Decile 1 | 0.376545 |
| Minimum | -0.188607 |
|

|
- Mean = 0.542709
- Std.dev = 0.122837
- 29 items below graph minimum of 0
|
2 Instances
Instance 2 : Imaging visit (2014+)
79,153 participants, 79,153 items
| Maximum | 0.854278 |
| Decile 9 | 0.686658 |
| Decile 8 | 0.648231 |
| Decile 7 | 0.617499 |
| Decile 6 | 0.587961 |
| Median | 0.557811 |
| Decile 4 | 0.526207 |
| Decile 3 | 0.489665 |
| Decile 2 | 0.44352 |
| Decile 1 | 0.3767 |
| Minimum | -0.188607 |
|
|
- Mean = 0.542629
- Std.dev = 0.122756
- 28 items below graph minimum of 0
|
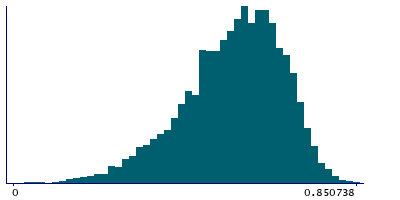
Instance 3 : First repeat imaging visit (2019+)
4,758 participants, 4,758 items
| Maximum | 0.850738 |
| Decile 9 | 0.690957 |
| Decile 8 | 0.651578 |
| Decile 7 | 0.620791 |
| Decile 6 | 0.589309 |
| Median | 0.559432 |
| Decile 4 | 0.52632 |
| Decile 3 | 0.488152 |
| Decile 2 | 0.444723 |
| Decile 1 | 0.372769 |
| Minimum | -0.023866 |
|
|
- Mean = 0.544024
- Std.dev = 0.124176
- 1 item below graph minimum of 0
|
Notes
Mean MO (diffusion tensor mode) in corticospinal tract (left) on FA (fractional anisotropy) skeleton (from dMRI data)
0 Related Data-Fields
There are no related data-fields
2 Applications
| Application ID | Title |
|---|
| 17689 | Genetic, environmental and lifestyle predictors of brain/cognitive-related outcomes. |
| 22783 | The joint analysis of imaging data and genetic data for early tumor detection, prevention, diagnosis and treatment |

