Data
83,911 items of data are available, covering 79,384 participants.
Defined-instances run from 2 to 3, labelled using Instancing
2.
Units of measurement are AU.
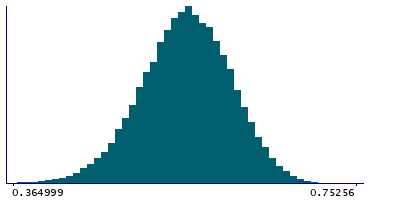
| Maximum | 0.755951 |
| Decile 9 | 0.626672 |
| Decile 8 | 0.605824 |
| Decile 7 | 0.590134 |
| Decile 6 | 0.576623 |
| Median | 0.563684 |
| Decile 4 | 0.550721 |
| Decile 3 | 0.536514 |
| Decile 2 | 0.519466 |
| Decile 1 | 0.495486 |
| Minimum | -0.109491 |
|
|
- Mean = 0.561835
- Std.dev = 0.0524259
- 121 items below graph minimum of 0.364299
|
2 Instances
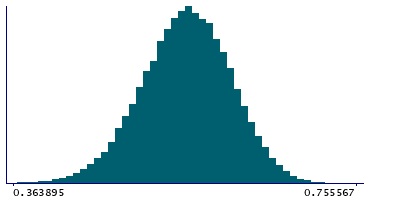
Instance 2 : Imaging visit (2014+)
79,153 participants, 79,153 items
| Maximum | 0.755951 |
| Decile 9 | 0.62685 |
| Decile 8 | 0.60602 |
| Decile 7 | 0.590314 |
| Decile 6 | 0.576812 |
| Median | 0.563819 |
| Decile 4 | 0.550772 |
| Decile 3 | 0.536544 |
| Decile 2 | 0.519494 |
| Decile 1 | 0.495455 |
| Minimum | -0.109491 |
|
|
- Mean = 0.561934
- Std.dev = 0.0524978
- 115 items below graph minimum of 0.36406
|
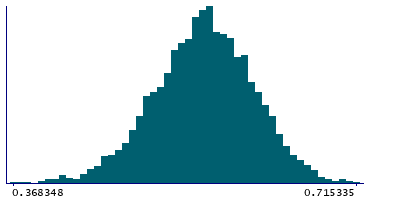
Instance 3 : First repeat imaging visit (2019+)
4,758 participants, 4,758 items
| Maximum | 0.715335 |
| Decile 9 | 0.623525 |
| Decile 8 | 0.602324 |
| Decile 7 | 0.587298 |
| Decile 6 | 0.573707 |
| Median | 0.561824 |
| Decile 4 | 0.550191 |
| Decile 3 | 0.535847 |
| Decile 2 | 0.518877 |
| Decile 1 | 0.495944 |
| Minimum | 0.021285 |
|
|
- Mean = 0.560189
- Std.dev = 0.0511861
- 5 items below graph minimum of 0.368363
|
Notes
Mean MO (diffusion tensor mode) in middle cerebellar peduncle on FA (fractional anisotropy) skeleton (from dMRI data)
0 Related Data-Fields
There are no related data-fields
2 Applications
| Application ID | Title |
|---|
| 17689 | Genetic, environmental and lifestyle predictors of brain/cognitive-related outcomes. |
| 22783 | The joint analysis of imaging data and genetic data for early tumor detection, prevention, diagnosis and treatment |

