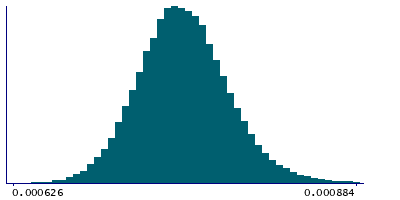
Data
83,911 items of data are available, covering 79,384 participants.
Defined-instances run from 2 to 3, labelled using Instancing
2.
Units of measurement are AU.
| Maximum | 0.00208 |
| Decile 9 | 0.000798 |
| Decile 8 | 0.000781 |
| Decile 7 | 0.00077 |
| Decile 6 | 0.000761 |
| Median | 0.000752 |
| Decile 4 | 0.000744 |
| Decile 3 | 0.000735 |
| Decile 2 | 0.000725 |
| Decile 1 | 0.000711 |
| Minimum | 0 |
|
|
- Mean = 0.000754004
- Std.dev = 3.81652e-05
- 17 items below graph minimum of 0.000624
- 347 items above graph maximum of 0.000885
|
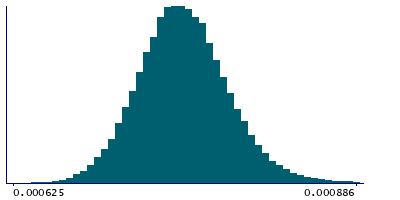
2 Instances
Instance 2 : Imaging visit (2014+)
79,153 participants, 79,153 items
| Maximum | 0.00208 |
| Decile 9 | 0.000799 |
| Decile 8 | 0.000782 |
| Decile 7 | 0.00077 |
| Decile 6 | 0.000761 |
| Median | 0.000752 |
| Decile 4 | 0.000744 |
| Decile 3 | 0.000735 |
| Decile 2 | 0.000725 |
| Decile 1 | 0.000711 |
| Minimum | 0 |
|
|
- Mean = 0.000754345
- Std.dev = 3.82764e-05
- 15 items below graph minimum of 0.000623
- 312 items above graph maximum of 0.000887
|
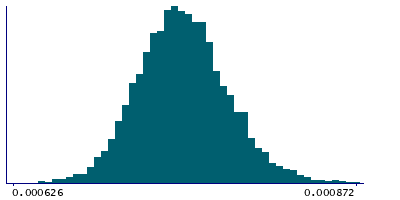
Instance 3 : First repeat imaging visit (2019+)
4,758 participants, 4,758 items
| Maximum | 0.001311 |
| Decile 9 | 0.00079 |
| Decile 8 | 0.000774 |
| Decile 7 | 0.000763 |
| Decile 6 | 0.000755 |
| Median | 0.000746 |
| Decile 4 | 0.000739 |
| Decile 3 | 0.00073 |
| Decile 2 | 0.000721 |
| Decile 1 | 0.000708 |
| Minimum | 0.000597 |
|
|
- Mean = 0.000748332
- Std.dev = 3.57912e-05
- 1 item below graph minimum of 0.000626
- 20 items above graph maximum of 0.000872
|
Notes
Mean MD (mean diffusivity) in cingulum hippocampus (left) on FA (fractional anisotropy) skeleton (from dMRI data)
0 Related Data-Fields
There are no related data-fields
2 Applications
| Application ID | Title |
|---|
| 17689 | Genetic, environmental and lifestyle predictors of brain/cognitive-related outcomes. |
| 22783 | The joint analysis of imaging data and genetic data for early tumor detection, prevention, diagnosis and treatment |

