Data
83,911 items of data are available, covering 79,384 participants.
Defined-instances run from 2 to 3, labelled using Instancing
2.
Units of measurement are AU.
| Maximum | 0.001177 |
| Decile 9 | 0.000798 |
| Decile 8 | 0.000784 |
| Decile 7 | 0.000775 |
| Decile 6 | 0.000767 |
| Median | 0.00076 |
| Decile 4 | 0.000754 |
| Decile 3 | 0.000746 |
| Decile 2 | 0.000738 |
| Decile 1 | 0.000727 |
| Minimum | 0.00041 |
|
|
- Mean = 0.000761416
- Std.dev = 2.88652e-05
- 74 items below graph minimum of 0.000656
- 93 items above graph maximum of 0.000869
|
2 Instances
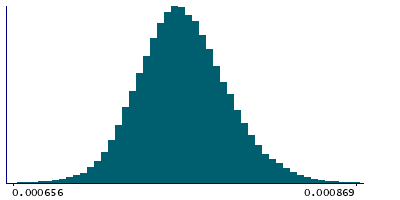
Instance 2 : Imaging visit (2014+)
79,153 participants, 79,153 items
| Maximum | 0.001177 |
| Decile 9 | 0.000798 |
| Decile 8 | 0.000784 |
| Decile 7 | 0.000775 |
| Decile 6 | 0.000767 |
| Median | 0.00076 |
| Decile 4 | 0.000754 |
| Decile 3 | 0.000746 |
| Decile 2 | 0.000738 |
| Decile 1 | 0.000727 |
| Minimum | 0.00041 |
|

|
- Mean = 0.000761397
- Std.dev = 2.9032e-05
- 72 items below graph minimum of 0.000656
- 91 items above graph maximum of 0.000869
|
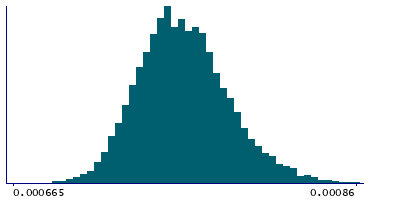
Instance 3 : First repeat imaging visit (2019+)
4,758 participants, 4,758 items
| Maximum | 0.000893 |
| Decile 9 | 0.000795 |
| Decile 8 | 0.000782 |
| Decile 7 | 0.000774 |
| Decile 6 | 0.000767 |
| Median | 0.00076 |
| Decile 4 | 0.000753 |
| Decile 3 | 0.000747 |
| Decile 2 | 0.00074 |
| Decile 1 | 0.00073 |
| Minimum | 0.000628 |
|
|
- Mean = 0.000761741
- Std.dev = 2.59317e-05
- 3 items below graph minimum of 0.000665
- 6 items above graph maximum of 0.00086
|
Notes
Mean MD (mean diffusivity) in cingulum cingulate gyrus (right) on FA (fractional anisotropy) skeleton (from dMRI data)
0 Related Data-Fields
There are no related data-fields
2 Applications
| Application ID | Title |
|---|
| 17689 | Genetic, environmental and lifestyle predictors of brain/cognitive-related outcomes. |
| 22783 | The joint analysis of imaging data and genetic data for early tumor detection, prevention, diagnosis and treatment |

