Data
83,911 items of data are available, covering 79,384 participants.
Defined-instances run from 2 to 3, labelled using Instancing
2.
Units of measurement are AU.
| Maximum | 0.002325 |
| Decile 9 | 0.000909 |
| Decile 8 | 0.000877 |
| Decile 7 | 0.000858 |
| Decile 6 | 0.000844 |
| Median | 0.000832 |
| Decile 4 | 0.000821 |
| Decile 3 | 0.00081 |
| Decile 2 | 0.000797 |
| Decile 1 | 0.000781 |
| Minimum | 0 |
|
|
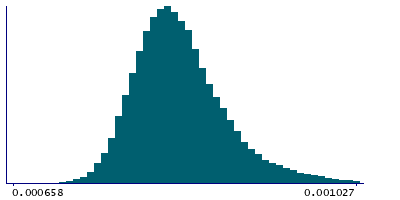
- Mean = 0.000840571
- Std.dev = 5.57532e-05
- 5 items below graph minimum of 0.000653
- 641 items above graph maximum of 0.001037
|
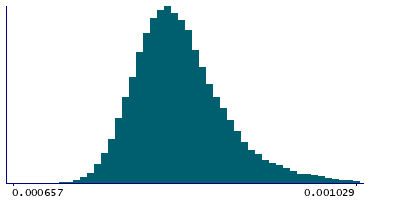
2 Instances
Instance 2 : Imaging visit (2014+)
79,153 participants, 79,153 items
| Maximum | 0.002325 |
| Decile 9 | 0.000909 |
| Decile 8 | 0.000878 |
| Decile 7 | 0.000859 |
| Decile 6 | 0.000845 |
| Median | 0.000833 |
| Decile 4 | 0.000822 |
| Decile 3 | 0.00081 |
| Decile 2 | 0.000798 |
| Decile 1 | 0.000781 |
| Minimum | 0 |
|
|
- Mean = 0.00084126
- Std.dev = 5.60183e-05
- 5 items below graph minimum of 0.000653
- 619 items above graph maximum of 0.001037
|
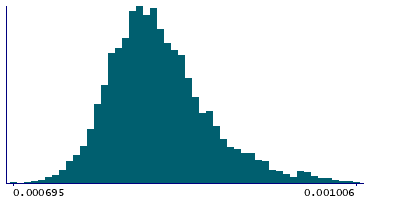
Instance 3 : First repeat imaging visit (2019+)
4,758 participants, 4,758 items
| Maximum | 0.001202 |
| Decile 9 | 0.000891 |
| Decile 8 | 0.000862 |
| Decile 7 | 0.000846 |
| Decile 6 | 0.000833 |
| Median | 0.000822 |
| Decile 4 | 0.000812 |
| Decile 3 | 0.000802 |
| Decile 2 | 0.00079 |
| Decile 1 | 0.000776 |
| Minimum | 0.000695 |
|
|
- Mean = 0.000829093
- Std.dev = 4.97589e-05
- 37 items above graph maximum of 0.001006
|
Notes
Mean MD (mean diffusivity) in posterior thalamic radiation (left) on FA (fractional anisotropy) skeleton (from dMRI data)
0 Related Data-Fields
There are no related data-fields
2 Applications
| Application ID | Title |
|---|
| 17689 | Genetic, environmental and lifestyle predictors of brain/cognitive-related outcomes. |
| 22783 | The joint analysis of imaging data and genetic data for early tumor detection, prevention, diagnosis and treatment |

