Data
83,911 items of data are available, covering 79,384 participants.
Defined-instances run from 2 to 3, labelled using Instancing
2.
Units of measurement are AU.
| Maximum | 0.001856 |
| Decile 9 | 0.000882 |
| Decile 8 | 0.000844 |
| Decile 7 | 0.000818 |
| Decile 6 | 0.000798 |
| Median | 0.00078 |
| Decile 4 | 0.000763 |
| Decile 3 | 0.000746 |
| Decile 2 | 0.000727 |
| Decile 1 | 0.000704 |
| Minimum | 0 |
|

|
- Mean = 0.000788381
- Std.dev = 7.25693e-05
- 6 items below graph minimum of 0.000526
- 264 items above graph maximum of 0.00106
|
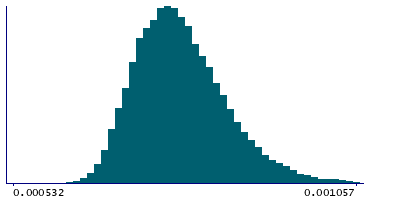
2 Instances
Instance 2 : Imaging visit (2014+)
79,153 participants, 79,153 items
| Maximum | 0.001856 |
| Decile 9 | 0.000882 |
| Decile 8 | 0.000844 |
| Decile 7 | 0.000818 |
| Decile 6 | 0.000798 |
| Median | 0.00078 |
| Decile 4 | 0.000763 |
| Decile 3 | 0.000746 |
| Decile 2 | 0.000728 |
| Decile 1 | 0.000705 |
| Minimum | 0 |
|
|
- Mean = 0.000788485
- Std.dev = 7.25058e-05
- 6 items below graph minimum of 0.000528
- 259 items above graph maximum of 0.001059
|
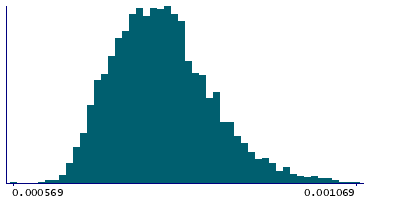
Instance 3 : First repeat imaging visit (2019+)
4,758 participants, 4,758 items
| Maximum | 0.001176 |
| Decile 9 | 0.0008835 |
| Decile 8 | 0.000844 |
| Decile 7 | 0.000817 |
| Decile 6 | 0.000799 |
| Median | 0.00078 |
| Decile 4 | 0.000762 |
| Decile 3 | 0.000743 |
| Decile 2 | 0.000723 |
| Decile 1 | 0.000697 |
| Minimum | 0.000569 |
|
|
- Mean = 0.000786656
- Std.dev = 7.35971e-05
- 8 items above graph maximum of 0.00107
|
Notes
Mean MD (mean diffusivity) in corticospinal tract (left) on FA (fractional anisotropy) skeleton (from dMRI data)
0 Related Data-Fields
There are no related data-fields
2 Applications
| Application ID | Title |
|---|
| 17689 | Genetic, environmental and lifestyle predictors of brain/cognitive-related outcomes. |
| 22783 | The joint analysis of imaging data and genetic data for early tumor detection, prevention, diagnosis and treatment |

