Data
83,911 items of data are available, covering 79,384 participants.
Defined-instances run from 2 to 3, labelled using Instancing
2.
Units of measurement are AU.
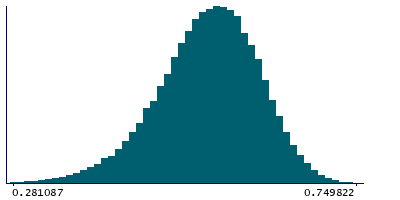
| Maximum | 0.757558 |
| Decile 9 | 0.628273 |
| Decile 8 | 0.602319 |
| Decile 7 | 0.582276 |
| Decile 6 | 0.564197 |
| Median | 0.54707 |
| Decile 4 | 0.529017 |
| Decile 3 | 0.508964 |
| Decile 2 | 0.484057 |
| Decile 1 | 0.44701 |
| Minimum | 0 |
|
|
- Mean = 0.541427
- Std.dev = 0.0715381
- 56 items below graph minimum of 0.265748
|
2 Instances
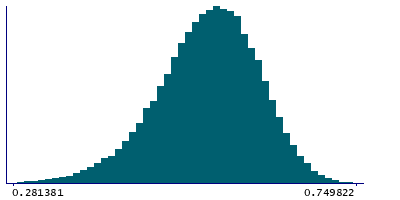
Instance 2 : Imaging visit (2014+)
79,153 participants, 79,153 items
| Maximum | 0.757558 |
| Decile 9 | 0.628128 |
| Decile 8 | 0.602124 |
| Decile 7 | 0.582057 |
| Decile 6 | 0.563932 |
| Median | 0.546806 |
| Decile 4 | 0.528718 |
| Decile 3 | 0.508652 |
| Decile 2 | 0.483652 |
| Decile 1 | 0.446431 |
| Minimum | 0 |
|
|
- Mean = 0.541117
- Std.dev = 0.0716589
- 52 items below graph minimum of 0.264733
|
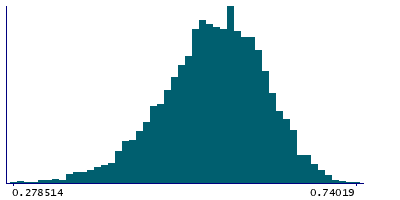
Instance 3 : First repeat imaging visit (2019+)
4,758 participants, 4,758 items
| Maximum | 0.74019 |
| Decile 9 | 0.631041 |
| Decile 8 | 0.605525 |
| Decile 7 | 0.586284 |
| Decile 6 | 0.569014 |
| Median | 0.551107 |
| Decile 4 | 0.533431 |
| Decile 3 | 0.515319 |
| Decile 2 | 0.490611 |
| Decile 1 | 0.454794 |
| Minimum | 0.252068 |
|
|
- Mean = 0.546589
- Std.dev = 0.0692935
- 2 items below graph minimum of 0.278548
|
Notes
Mean FA (fractional anisotropy) in tapetum (right) on FA skeleton (from dMRI data)
0 Related Data-Fields
There are no related data-fields
2 Applications
| Application ID | Title |
|---|
| 17689 | Genetic, environmental and lifestyle predictors of brain/cognitive-related outcomes. |
| 22783 | The joint analysis of imaging data and genetic data for early tumor detection, prevention, diagnosis and treatment |

