Data
83,911 items of data are available, covering 79,384 participants.
Defined-instances run from 2 to 3, labelled using Instancing
2.
Units of measurement are AU.
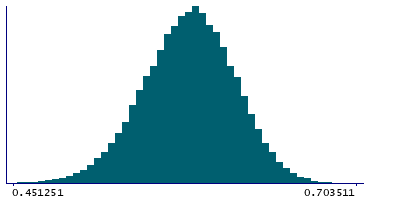
| Maximum | 0.703511 |
| Decile 9 | 0.622338 |
| Decile 8 | 0.608448 |
| Decile 7 | 0.598162 |
| Decile 6 | 0.589091 |
| Median | 0.580659 |
| Decile 4 | 0.572103 |
| Decile 3 | 0.562657 |
| Decile 2 | 0.551186 |
| Decile 1 | 0.53521 |
| Minimum | 0.169064 |
|
|
- Mean = 0.579343
- Std.dev = 0.0347684
- 97 items below graph minimum of 0.448082
|
2 Instances
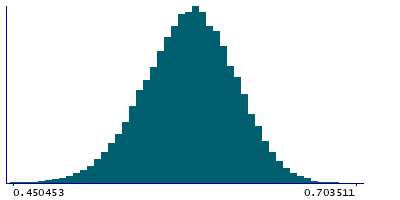
Instance 2 : Imaging visit (2014+)
79,153 participants, 79,153 items
| Maximum | 0.703511 |
| Decile 9 | 0.622327 |
| Decile 8 | 0.608397 |
| Decile 7 | 0.598073 |
| Decile 6 | 0.588994 |
| Median | 0.580559 |
| Decile 4 | 0.572035 |
| Decile 3 | 0.562525 |
| Decile 2 | 0.55106 |
| Decile 1 | 0.535063 |
| Minimum | 0.169064 |
|
|
- Mean = 0.579243
- Std.dev = 0.0348458
- 96 items below graph minimum of 0.447799
|
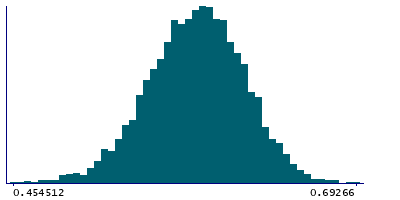
Instance 3 : First repeat imaging visit (2019+)
4,758 participants, 4,758 items
| Maximum | 0.69266 |
| Decile 9 | 0.62253 |
| Decile 8 | 0.609426 |
| Decile 7 | 0.599405 |
| Decile 6 | 0.590516 |
| Median | 0.582287 |
| Decile 4 | 0.573609 |
| Decile 3 | 0.564545 |
| Decile 2 | 0.553233 |
| Decile 1 | 0.538491 |
| Minimum | 0.419275 |
|
|
- Mean = 0.580995
- Std.dev = 0.0334121
- 2 items below graph minimum of 0.454452
|
Notes
Mean FA (fractional anisotropy) in cingulum cingulate gyrus (right) on FA skeleton (from dMRI data)
0 Related Data-Fields
There are no related data-fields
2 Applications
| Application ID | Title |
|---|
| 17689 | Genetic, environmental and lifestyle predictors of brain/cognitive-related outcomes. |
| 22783 | The joint analysis of imaging data and genetic data for early tumor detection, prevention, diagnosis and treatment |

