Data
83,911 items of data are available, covering 79,384 participants.
Defined-instances run from 2 to 3, labelled using Instancing
2.
Units of measurement are AU.
| Maximum | 0.698198 |
| Decile 9 | 0.605167 |
| Decile 8 | 0.592549 |
| Decile 7 | 0.582982 |
| Decile 6 | 0.574734 |
| Median | 0.5668 |
| Decile 4 | 0.558838 |
| Decile 3 | 0.550048 |
| Decile 2 | 0.539338 |
| Decile 1 | 0.524148 |
| Minimum | 0 |
|

|
- Mean = 0.565413
- Std.dev = 0.0326504
- 141 items below graph minimum of 0.443129
- 2 items above graph maximum of 0.686187
|
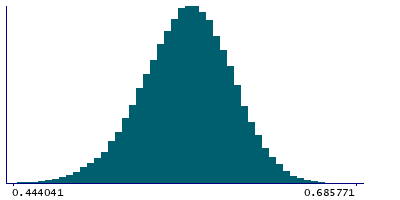
2 Instances
Instance 2 : Imaging visit (2014+)
79,153 participants, 79,153 items
| Maximum | 0.698198 |
| Decile 9 | 0.605063 |
| Decile 8 | 0.592476 |
| Decile 7 | 0.58285 |
| Decile 6 | 0.574588 |
| Median | 0.566685 |
| Decile 4 | 0.558694 |
| Decile 3 | 0.549883 |
| Decile 2 | 0.539139 |
| Decile 1 | 0.523856 |
| Minimum | 0 |
|
|
- Mean = 0.565258
- Std.dev = 0.0327305
- 134 items below graph minimum of 0.442649
- 2 items above graph maximum of 0.686269
|
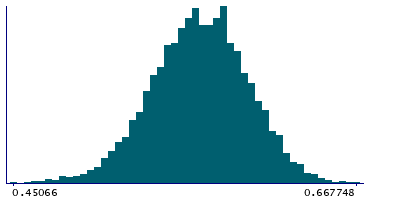
Instance 3 : First repeat imaging visit (2019+)
4,758 participants, 4,758 items
| Maximum | 0.667748 |
| Decile 9 | 0.606853 |
| Decile 8 | 0.593926 |
| Decile 7 | 0.584596 |
| Decile 6 | 0.576958 |
| Median | 0.568822 |
| Decile 4 | 0.561301 |
| Decile 3 | 0.552512 |
| Decile 2 | 0.542723 |
| Decile 1 | 0.528741 |
| Minimum | 0.391256 |
|
|
- Mean = 0.567984
- Std.dev = 0.0311751
- 8 items below graph minimum of 0.45063
|
Notes
Mean FA (fractional anisotropy) in sagittal stratum (left) on FA skeleton (from dMRI data)
0 Related Data-Fields
There are no related data-fields
2 Applications
| Application ID | Title |
|---|
| 17689 | Genetic, environmental and lifestyle predictors of brain/cognitive-related outcomes. |
| 22783 | The joint analysis of imaging data and genetic data for early tumor detection, prevention, diagnosis and treatment |

