Data
83,911 items of data are available, covering 79,384 participants.
Defined-instances run from 2 to 3, labelled using Instancing
2.
Units of measurement are AU.
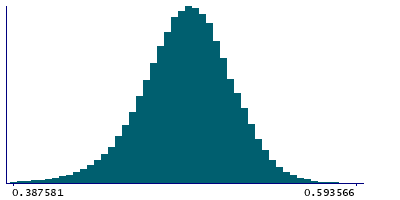
| Maximum | 0.653737 |
| Decile 9 | 0.525454 |
| Decile 8 | 0.513999 |
| Decile 7 | 0.505866 |
| Decile 6 | 0.498923 |
| Median | 0.492352 |
| Decile 4 | 0.485586 |
| Decile 3 | 0.478233 |
| Decile 2 | 0.469188 |
| Decile 1 | 0.455414 |
| Minimum | 0.221561 |
|
|
- Mean = 0.490769
- Std.dev = 0.0290004
- 340 items below graph minimum of 0.385374
- 5 items above graph maximum of 0.595494
|
2 Instances
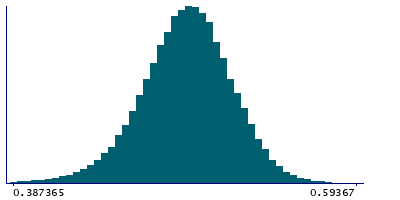
Instance 2 : Imaging visit (2014+)
79,153 participants, 79,153 items
| Maximum | 0.629761 |
| Decile 9 | 0.525478 |
| Decile 8 | 0.513997 |
| Decile 7 | 0.505817 |
| Decile 6 | 0.498891 |
| Median | 0.492294 |
| Decile 4 | 0.485522 |
| Decile 3 | 0.478124 |
| Decile 2 | 0.469046 |
| Decile 1 | 0.455252 |
| Minimum | 0.221561 |
|
|
- Mean = 0.490695
- Std.dev = 0.0290908
- 323 items below graph minimum of 0.385026
- 4 items above graph maximum of 0.595705
|
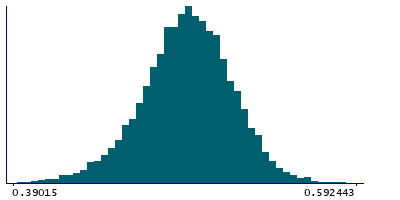
Instance 3 : First repeat imaging visit (2019+)
4,758 participants, 4,758 items
| Maximum | 0.653737 |
| Decile 9 | 0.525021 |
| Decile 8 | 0.514083 |
| Decile 7 | 0.506597 |
| Decile 6 | 0.499613 |
| Median | 0.493105 |
| Decile 4 | 0.486762 |
| Decile 3 | 0.479962 |
| Decile 2 | 0.471478 |
| Decile 1 | 0.457577 |
| Minimum | 0.348848 |
|
|
- Mean = 0.491997
- Std.dev = 0.0274222
- 18 items below graph minimum of 0.390134
- 1 item above graph maximum of 0.592464
|
Notes
Mean FA (fractional anisotropy) in posterior corona radiata (right) on FA skeleton (from dMRI data)
0 Related Data-Fields
There are no related data-fields
2 Applications
| Application ID | Title |
|---|
| 17689 | Genetic, environmental and lifestyle predictors of brain/cognitive-related outcomes. |
| 22783 | The joint analysis of imaging data and genetic data for early tumor detection, prevention, diagnosis and treatment |

