Data
83,911 items of data are available, covering 79,384 participants.
Defined-instances run from 2 to 3, labelled using Instancing
2.
Units of measurement are AU.
| Maximum | 0.655614 |
| Decile 9 | 0.513843 |
| Decile 8 | 0.503077 |
| Decile 7 | 0.495283 |
| Decile 6 | 0.488551 |
| Median | 0.482247 |
| Decile 4 | 0.475823 |
| Decile 3 | 0.468976 |
| Decile 2 | 0.460806 |
| Decile 1 | 0.448885 |
| Minimum | 0.192157 |
|

|
- Mean = 0.481626
- Std.dev = 0.0259106
- 103 items below graph minimum of 0.383927
- 8 items above graph maximum of 0.578801
|
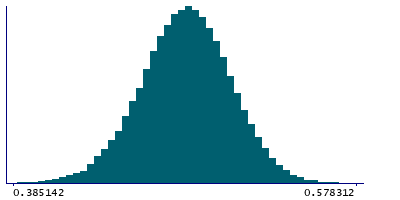
2 Instances
Instance 2 : Imaging visit (2014+)
79,153 participants, 79,153 items
| Maximum | 0.646784 |
| Decile 9 | 0.513786 |
| Decile 8 | 0.502974 |
| Decile 7 | 0.495192 |
| Decile 6 | 0.488423 |
| Median | 0.482142 |
| Decile 4 | 0.475708 |
| Decile 3 | 0.468834 |
| Decile 2 | 0.460685 |
| Decile 1 | 0.448762 |
| Minimum | 0.192157 |
|
|
- Mean = 0.481513
- Std.dev = 0.0259587
- 99 items below graph minimum of 0.383737
- 7 items above graph maximum of 0.578811
|
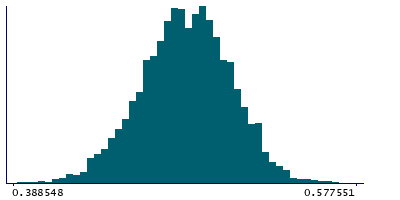
Instance 3 : First repeat imaging visit (2019+)
4,758 participants, 4,758 items
| Maximum | 0.655614 |
| Decile 9 | 0.51455 |
| Decile 8 | 0.50463 |
| Decile 7 | 0.496905 |
| Decile 6 | 0.490695 |
| Median | 0.483974 |
| Decile 4 | 0.477792 |
| Decile 3 | 0.471201 |
| Decile 2 | 0.462905 |
| Decile 1 | 0.451507 |
| Minimum | 0.346264 |
|
|
- Mean = 0.483501
- Std.dev = 0.0250226
- 5 items below graph minimum of 0.388464
- 1 item above graph maximum of 0.577594
|
Notes
Mean FA (fractional anisotropy) in superior corona radiata (right) on FA skeleton (from dMRI data)
0 Related Data-Fields
There are no related data-fields
2 Applications
| Application ID | Title |
|---|
| 17689 | Genetic, environmental and lifestyle predictors of brain/cognitive-related outcomes. |
| 22783 | The joint analysis of imaging data and genetic data for early tumor detection, prevention, diagnosis and treatment |

