Data
83,911 items of data are available, covering 79,384 participants.
Defined-instances run from 2 to 3, labelled using Instancing
2.
Units of measurement are AU.
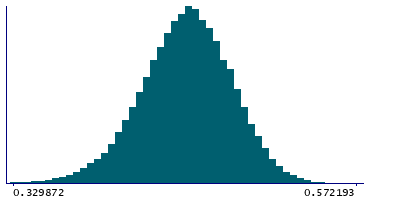
| Maximum | 0.693084 |
| Decile 9 | 0.490818 |
| Decile 8 | 0.477644 |
| Decile 7 | 0.467943 |
| Decile 6 | 0.459462 |
| Median | 0.451759 |
| Decile 4 | 0.443592 |
| Decile 3 | 0.434782 |
| Decile 2 | 0.424106 |
| Decile 1 | 0.408865 |
| Minimum | 0.241969 |
|
|
- Mean = 0.450405
- Std.dev = 0.0325297
- 93 items below graph minimum of 0.326913
- 2 items above graph maximum of 0.57277
|
2 Instances
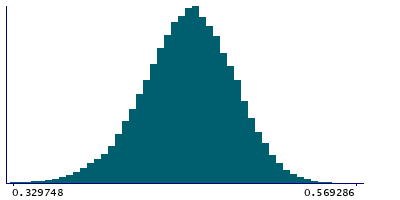
Instance 2 : Imaging visit (2014+)
79,153 participants, 79,153 items
| Maximum | 0.587766 |
| Decile 9 | 0.490636 |
| Decile 8 | 0.477424 |
| Decile 7 | 0.467759 |
| Decile 6 | 0.459228 |
| Median | 0.451476 |
| Decile 4 | 0.443312 |
| Decile 3 | 0.434515 |
| Decile 2 | 0.423836 |
| Decile 1 | 0.408589 |
| Minimum | 0.241969 |
|
|
- Mean = 0.450151
- Std.dev = 0.032542
- 90 items below graph minimum of 0.326542
- 1 item above graph maximum of 0.572682
|
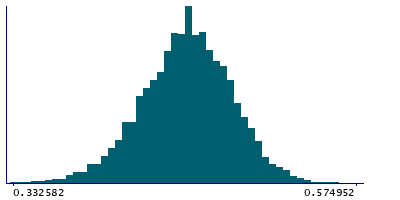
Instance 3 : First repeat imaging visit (2019+)
4,758 participants, 4,758 items
| Maximum | 0.693084 |
| Decile 9 | 0.494184 |
| Decile 8 | 0.481429 |
| Decile 7 | 0.471469 |
| Decile 6 | 0.463284 |
| Median | 0.455776 |
| Decile 4 | 0.448018 |
| Decile 3 | 0.439652 |
| Decile 2 | 0.42861 |
| Decile 1 | 0.413372 |
| Minimum | 0.29172 |
|
|
- Mean = 0.454617
- Std.dev = 0.0320319
- 4 items below graph minimum of 0.332559
- 1 item above graph maximum of 0.574996
|
Notes
Mean FA (fractional anisotropy) in anterior corona radiata (left) on FA skeleton (from dMRI data)
0 Related Data-Fields
There are no related data-fields
2 Applications
| Application ID | Title |
|---|
| 17689 | Genetic, environmental and lifestyle predictors of brain/cognitive-related outcomes. |
| 22783 | The joint analysis of imaging data and genetic data for early tumor detection, prevention, diagnosis and treatment |

