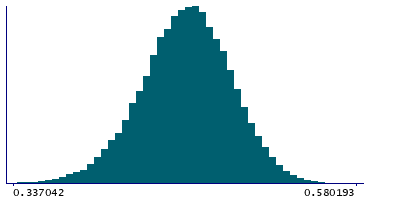
Data
83,911 items of data are available, covering 79,384 participants.
Defined-instances run from 2 to 3, labelled using Instancing
2.
Units of measurement are AU.
| Maximum | 0.656024 |
| Decile 9 | 0.498541 |
| Decile 8 | 0.485386 |
| Decile 7 | 0.475617 |
| Decile 6 | 0.467177 |
| Median | 0.45915 |
| Decile 4 | 0.451074 |
| Decile 3 | 0.44228 |
| Decile 2 | 0.431748 |
| Decile 1 | 0.416354 |
| Minimum | 0.075 |
|
|
- Mean = 0.458
- Std.dev = 0.0327138
- 92 items below graph minimum of 0.334167
- 1 item above graph maximum of 0.580728
|
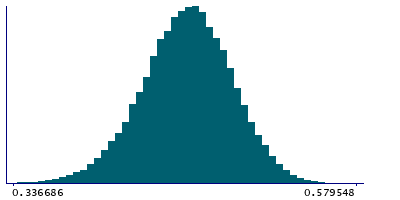
2 Instances
Instance 2 : Imaging visit (2014+)
79,153 participants, 79,153 items
| Maximum | 0.579548 |
| Decile 9 | 0.498464 |
| Decile 8 | 0.485274 |
| Decile 7 | 0.475475 |
| Decile 6 | 0.466998 |
| Median | 0.458962 |
| Decile 4 | 0.450894 |
| Decile 3 | 0.442027 |
| Decile 2 | 0.43152 |
| Decile 1 | 0.416122 |
| Minimum | 0.075 |
|
|
- Mean = 0.457816
- Std.dev = 0.0327794
- 86 items below graph minimum of 0.333779
|
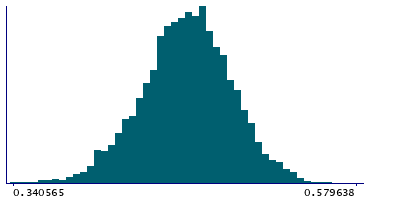
Instance 3 : First repeat imaging visit (2019+)
4,758 participants, 4,758 items
| Maximum | 0.656024 |
| Decile 9 | 0.499953 |
| Decile 8 | 0.486888 |
| Decile 7 | 0.47733 |
| Decile 6 | 0.469825 |
| Median | 0.462095 |
| Decile 4 | 0.454033 |
| Decile 3 | 0.445956 |
| Decile 2 | 0.435898 |
| Decile 1 | 0.420203 |
| Minimum | 0.29318 |
|
|
- Mean = 0.461064
- Std.dev = 0.0314448
- 4 items below graph minimum of 0.340453
- 1 item above graph maximum of 0.579703
|
Notes
Mean FA (fractional anisotropy) in anterior corona radiata (right) on FA skeleton (from dMRI data)
0 Related Data-Fields
There are no related data-fields
2 Applications
| Application ID | Title |
|---|
| 17689 | Genetic, environmental and lifestyle predictors of brain/cognitive-related outcomes. |
| 22783 | The joint analysis of imaging data and genetic data for early tumor detection, prevention, diagnosis and treatment |

