Data
83,911 items of data are available, covering 79,384 participants.
Defined-instances run from 2 to 3, labelled using Instancing
2.
Units of measurement are AU.
| Maximum | 0.818605 |
| Decile 9 | 0.718817 |
| Decile 8 | 0.708682 |
| Decile 7 | 0.701533 |
| Decile 6 | 0.695242 |
| Median | 0.689222 |
| Decile 4 | 0.683186 |
| Decile 3 | 0.676543 |
| Decile 2 | 0.668563 |
| Decile 1 | 0.65749 |
| Minimum | 0 |
|

|
- Mean = 0.688494
- Std.dev = 0.0244825
- 69 items below graph minimum of 0.596163
- 12 items above graph maximum of 0.780145
|
2 Instances
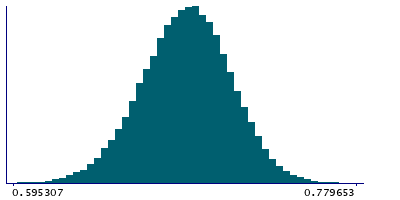
Instance 2 : Imaging visit (2014+)
79,153 participants, 79,153 items
| Maximum | 0.818605 |
| Decile 9 | 0.71889 |
| Decile 8 | 0.708716 |
| Decile 7 | 0.701544 |
| Decile 6 | 0.695229 |
| Median | 0.689209 |
| Decile 4 | 0.683153 |
| Decile 3 | 0.676507 |
| Decile 2 | 0.668488 |
| Decile 1 | 0.657376 |
| Minimum | 0 |
|
|
- Mean = 0.688482
- Std.dev = 0.024546
- 63 items below graph minimum of 0.595861
- 10 items above graph maximum of 0.780405
|
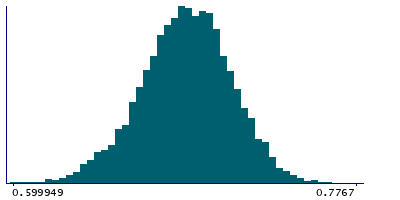
Instance 3 : First repeat imaging visit (2019+)
4,758 participants, 4,758 items
| Maximum | 0.795094 |
| Decile 9 | 0.717795 |
| Decile 8 | 0.70809 |
| Decile 7 | 0.701315 |
| Decile 6 | 0.695402 |
| Median | 0.689446 |
| Decile 4 | 0.683707 |
| Decile 3 | 0.677302 |
| Decile 2 | 0.669754 |
| Decile 1 | 0.658854 |
| Minimum | 0.542285 |
|
|
- Mean = 0.688687
- Std.dev = 0.0234002
- 6 items below graph minimum of 0.599914
- 1 item above graph maximum of 0.776735
|
Notes
Mean FA (fractional anisotropy) in posterior limb of internal capsule (left) on FA skeleton (from dMRI data)
0 Related Data-Fields
There are no related data-fields
2 Applications
| Application ID | Title |
|---|
| 17689 | Genetic, environmental and lifestyle predictors of brain/cognitive-related outcomes. |
| 22783 | The joint analysis of imaging data and genetic data for early tumor detection, prevention, diagnosis and treatment |

