Data
83,911 items of data are available, covering 79,384 participants.
Defined-instances run from 2 to 3, labelled using Instancing
2.
Units of measurement are AU.
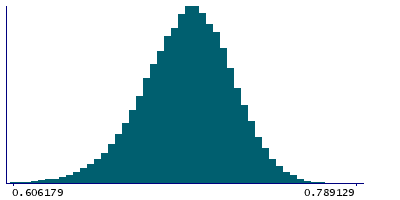
| Maximum | 0.794303 |
| Decile 9 | 0.728884 |
| Decile 8 | 0.719451 |
| Decile 7 | 0.71247 |
| Decile 6 | 0.706304 |
| Median | 0.70046 |
| Decile 4 | 0.694406 |
| Decile 3 | 0.687703 |
| Decile 2 | 0.679582 |
| Decile 1 | 0.667734 |
| Minimum | 0 |
|
|
- Mean = 0.698849
- Std.dev = 0.0259013
- 243 items below graph minimum of 0.606584
- 1 item above graph maximum of 0.790035
|
2 Instances
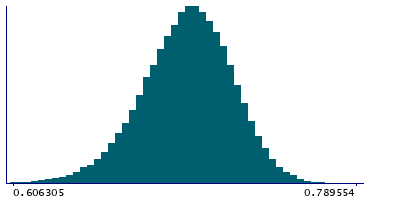
Instance 2 : Imaging visit (2014+)
79,153 participants, 79,153 items
| Maximum | 0.794303 |
| Decile 9 | 0.7289 |
| Decile 8 | 0.719466 |
| Decile 7 | 0.712471 |
| Decile 6 | 0.70631 |
| Median | 0.700465 |
| Decile 4 | 0.694389 |
| Decile 3 | 0.687666 |
| Decile 2 | 0.679515 |
| Decile 1 | 0.667662 |
| Minimum | 0 |
|
|
- Mean = 0.698818
- Std.dev = 0.025991
- 229 items below graph minimum of 0.606424
- 1 item above graph maximum of 0.790137
|
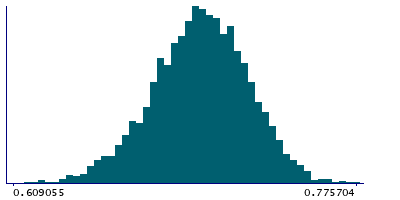
Instance 3 : First repeat imaging visit (2019+)
4,758 participants, 4,758 items
| Maximum | 0.775704 |
| Decile 9 | 0.728758 |
| Decile 8 | 0.719248 |
| Decile 7 | 0.712465 |
| Decile 6 | 0.706229 |
| Median | 0.700369 |
| Decile 4 | 0.694611 |
| Decile 3 | 0.688341 |
| Decile 2 | 0.680437 |
| Decile 1 | 0.668907 |
| Minimum | 0.462005 |
|
|
- Mean = 0.699354
- Std.dev = 0.0243544
- 13 items below graph minimum of 0.609057
|
Notes
Mean FA (fractional anisotropy) in superior cerebellar peduncle (right) on FA skeleton (from dMRI data)
0 Related Data-Fields
There are no related data-fields
2 Applications
| Application ID | Title |
|---|
| 17689 | Genetic, environmental and lifestyle predictors of brain/cognitive-related outcomes. |
| 22783 | The joint analysis of imaging data and genetic data for early tumor detection, prevention, diagnosis and treatment |

