Data
83,911 items of data are available, covering 79,384 participants.
Defined-instances run from 2 to 3, labelled using Instancing
2.
Units of measurement are AU.
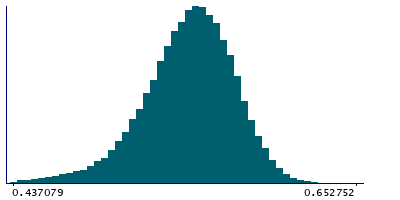
| Maximum | 0.685263 |
| Decile 9 | 0.580024 |
| Decile 8 | 0.56968 |
| Decile 7 | 0.561808 |
| Decile 6 | 0.554733 |
| Median | 0.547981 |
| Decile 4 | 0.54089 |
| Decile 3 | 0.533057 |
| Decile 2 | 0.523157 |
| Decile 1 | 0.507752 |
| Minimum | 0 |
|

|
- Mean = 0.544759
- Std.dev = 0.0320257
- 698 items below graph minimum of 0.435479
- 2 items above graph maximum of 0.652297
|
2 Instances
Instance 2 : Imaging visit (2014+)
79,153 participants, 79,153 items
| Maximum | 0.664705 |
| Decile 9 | 0.579816 |
| Decile 8 | 0.569462 |
| Decile 7 | 0.561578 |
| Decile 6 | 0.554511 |
| Median | 0.547724 |
| Decile 4 | 0.540639 |
| Decile 3 | 0.532753 |
| Decile 2 | 0.522876 |
| Decile 1 | 0.5075 |
| Minimum | 0 |
|
|
- Mean = 0.544513
- Std.dev = 0.032019
- 650 items below graph minimum of 0.435185
- 1 item above graph maximum of 0.652131
|
Instance 3 : First repeat imaging visit (2019+)
4,758 participants, 4,758 items
| Maximum | 0.685263 |
| Decile 9 | 0.58396 |
| Decile 8 | 0.573117 |
| Decile 7 | 0.565402 |
| Decile 6 | 0.558463 |
| Median | 0.551915 |
| Decile 4 | 0.54533 |
| Decile 3 | 0.537785 |
| Decile 2 | 0.528193 |
| Decile 1 | 0.513083 |
| Minimum | 0.349154 |
|

|
- Mean = 0.548847
- Std.dev = 0.0318598
- 52 items below graph minimum of 0.442205
- 1 item above graph maximum of 0.654838
|
Notes
Mean FA (fractional anisotropy) in inferior cerebellar peduncle (left) on FA skeleton (from dMRI data)
0 Related Data-Fields
There are no related data-fields
2 Applications
| Application ID | Title |
|---|
| 17689 | Genetic, environmental and lifestyle predictors of brain/cognitive-related outcomes. |
| 22783 | The joint analysis of imaging data and genetic data for early tumor detection, prevention, diagnosis and treatment |

