Data
83,911 items of data are available, covering 79,384 participants.
Defined-instances run from 2 to 3, labelled using Instancing
2.
Units of measurement are AU.
| Maximum | 0.73908 |
| Decile 9 | 0.582002 |
| Decile 8 | 0.571295 |
| Decile 7 | 0.56333 |
| Decile 6 | 0.556305 |
| Median | 0.54957 |
| Decile 4 | 0.542587 |
| Decile 3 | 0.534691 |
| Decile 2 | 0.524954 |
| Decile 1 | 0.510051 |
| Minimum | 0 |
|

|
- Mean = 0.546639
- Std.dev = 0.0318334
- 707 items below graph minimum of 0.438101
- 2 items above graph maximum of 0.653952
|
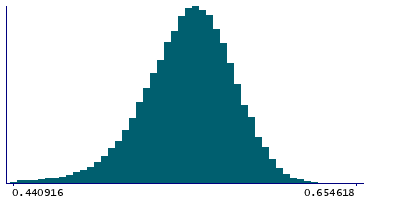
2 Instances
Instance 2 : Imaging visit (2014+)
79,153 participants, 79,153 items
| Maximum | 0.655267 |
| Decile 9 | 0.581781 |
| Decile 8 | 0.571048 |
| Decile 7 | 0.563057 |
| Decile 6 | 0.55602 |
| Median | 0.549256 |
| Decile 4 | 0.54225 |
| Decile 3 | 0.534364 |
| Decile 2 | 0.524633 |
| Decile 1 | 0.509742 |
| Minimum | 0 |
|
|
- Mean = 0.546351
- Std.dev = 0.0318296
- 659 items below graph minimum of 0.437703
- 1 item above graph maximum of 0.653821
|
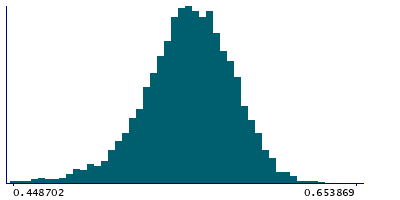
Instance 3 : First repeat imaging visit (2019+)
4,758 participants, 4,758 items
| Maximum | 0.73908 |
| Decile 9 | 0.58548 |
| Decile 8 | 0.575467 |
| Decile 7 | 0.567436 |
| Decile 6 | 0.560775 |
| Median | 0.554041 |
| Decile 4 | 0.547802 |
| Decile 3 | 0.540836 |
| Decile 2 | 0.531333 |
| Decile 1 | 0.517079 |
| Minimum | 0.289902 |
|
|
- Mean = 0.551433
- Std.dev = 0.0315122
- 60 items below graph minimum of 0.448678
- 1 item above graph maximum of 0.653881
|
Notes
Mean FA (fractional anisotropy) in inferior cerebellar peduncle (right) on FA skeleton (from dMRI data)
0 Related Data-Fields
There are no related data-fields
2 Applications
| Application ID | Title |
|---|
| 17689 | Genetic, environmental and lifestyle predictors of brain/cognitive-related outcomes. |
| 22783 | The joint analysis of imaging data and genetic data for early tumor detection, prevention, diagnosis and treatment |

