Data
83,911 items of data are available, covering 79,384 participants.
Defined-instances run from 2 to 3, labelled using Instancing
2.
Units of measurement are AU.
| Maximum | 0.811385 |
| Decile 9 | 0.623269 |
| Decile 8 | 0.612594 |
| Decile 7 | 0.604847 |
| Decile 6 | 0.597829 |
| Median | 0.591125 |
| Decile 4 | 0.584298 |
| Decile 3 | 0.576782 |
| Decile 2 | 0.567661 |
| Decile 1 | 0.554061 |
| Minimum | 0 |
|
|
- Mean = 0.589356
- Std.dev = 0.0287943
- 275 items below graph minimum of 0.484852
- 4 items above graph maximum of 0.692478
|
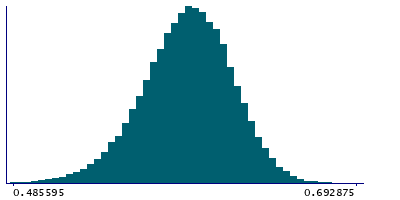
2 Instances
Instance 2 : Imaging visit (2014+)
79,153 participants, 79,153 items
| Maximum | 0.709569 |
| Decile 9 | 0.623036 |
| Decile 8 | 0.612376 |
| Decile 7 | 0.604592 |
| Decile 6 | 0.597506 |
| Median | 0.590855 |
| Decile 4 | 0.584009 |
| Decile 3 | 0.576452 |
| Decile 2 | 0.567303 |
| Decile 1 | 0.553697 |
| Minimum | 0 |
|

|
- Mean = 0.589058
- Std.dev = 0.0288551
- 255 items below graph minimum of 0.484359
- 3 items above graph maximum of 0.692374
|
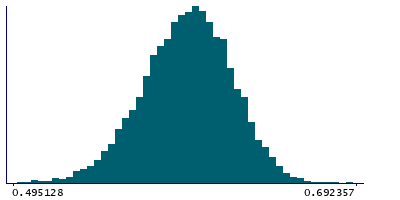
Instance 3 : First repeat imaging visit (2019+)
4,758 participants, 4,758 items
| Maximum | 0.811385 |
| Decile 9 | 0.62662 |
| Decile 8 | 0.616605 |
| Decile 7 | 0.60899 |
| Decile 6 | 0.602224 |
| Median | 0.595878 |
| Decile 4 | 0.589241 |
| Decile 3 | 0.581913 |
| Decile 2 | 0.573573 |
| Decile 1 | 0.560808 |
| Minimum | 0.383449 |
|
|
- Mean = 0.594316
- Std.dev = 0.0272882
- 19 items below graph minimum of 0.494996
- 1 item above graph maximum of 0.692432
|
Notes
Mean FA (fractional anisotropy) in medial lemniscus (left) on FA skeleton (from dMRI data)
0 Related Data-Fields
There are no related data-fields
2 Applications
| Application ID | Title |
|---|
| 17689 | Genetic, environmental and lifestyle predictors of brain/cognitive-related outcomes. |
| 22783 | The joint analysis of imaging data and genetic data for early tumor detection, prevention, diagnosis and treatment |

