Data
83,911 items of data are available, covering 79,384 participants.
Defined-instances run from 2 to 3, labelled using Instancing
2.
Units of measurement are AU.
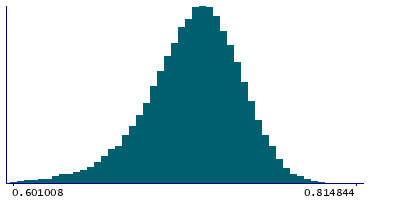
| Maximum | 0.814844 |
| Decile 9 | 0.747948 |
| Decile 8 | 0.737049 |
| Decile 7 | 0.728854 |
| Decile 6 | 0.721714 |
| Median | 0.714762 |
| Decile 4 | 0.707441 |
| Decile 3 | 0.699161 |
| Decile 2 | 0.688843 |
| Decile 1 | 0.672552 |
| Minimum | 0.169001 |
|
|
- Mean = 0.711789
- Std.dev = 0.0311524
- 292 items below graph minimum of 0.597157
|
2 Instances
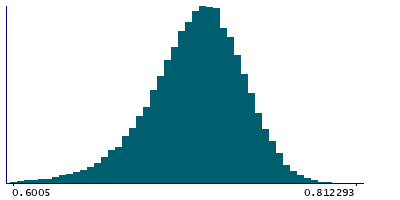
Instance 2 : Imaging visit (2014+)
79,153 participants, 79,153 items
| Maximum | 0.812293 |
| Decile 9 | 0.747865 |
| Decile 8 | 0.736907 |
| Decile 7 | 0.728694 |
| Decile 6 | 0.721583 |
| Median | 0.714593 |
| Decile 4 | 0.707245 |
| Decile 3 | 0.698937 |
| Decile 2 | 0.688578 |
| Decile 1 | 0.672207 |
| Minimum | 0.169001 |
|
|
- Mean = 0.711584
- Std.dev = 0.031263
- 270 items below graph minimum of 0.596549
|
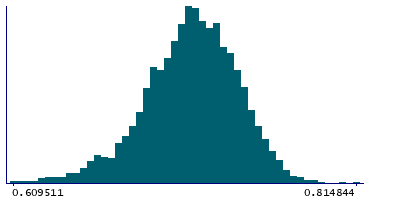
Instance 3 : First repeat imaging visit (2019+)
4,758 participants, 4,758 items
| Maximum | 0.814844 |
| Decile 9 | 0.749369 |
| Decile 8 | 0.739142 |
| Decile 7 | 0.731101 |
| Decile 6 | 0.724007 |
| Median | 0.717312 |
| Decile 4 | 0.710629 |
| Decile 3 | 0.70296 |
| Decile 2 | 0.69338 |
| Decile 1 | 0.679302 |
| Minimum | 0.519739 |
|
|
- Mean = 0.715206
- Std.dev = 0.0290395
- 13 items below graph minimum of 0.609236
|
Notes
Mean FA (fractional anisotropy) in body of corpus callosum on FA skeleton (from dMRI data)
0 Related Data-Fields
There are no related data-fields
2 Applications
| Application ID | Title |
|---|
| 17689 | Genetic, environmental and lifestyle predictors of brain/cognitive-related outcomes. |
| 22783 | The joint analysis of imaging data and genetic data for early tumor detection, prevention, diagnosis and treatment |

