Data
70,319 items of data are available, covering 66,458 participants.
Defined-instances run from 2 to 3, labelled using Instancing
2.
Units of measurement are Z.
| Maximum | 5.435 |
| Decile 9 | 2.289 |
| Decile 8 | 1.887 |
| Decile 7 | 1.613 |
| Decile 6 | 1.384 |
| Median | 1.173 |
| Decile 4 | 0.96485 |
| Decile 3 | 0.7404 |
| Decile 2 | 0.4792 |
| Decile 1 | 0.10115 |
| Minimum | -5.342 |
|

|
- Mean = 1.18384
- Std.dev = 0.872946
- 40 items below graph minimum of -2.0867
- 26 items above graph maximum of 4.47685
|
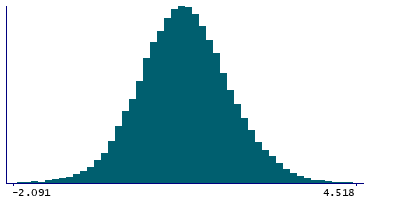
2 Instances
Instance 2 : Imaging visit (2014+)
66,035 participants, 66,035 items
| Maximum | 5.435 |
| Decile 9 | 2.281 |
| Decile 8 | 1.877 |
| Decile 7 | 1.603 |
| Decile 6 | 1.374 |
| Median | 1.163 |
| Decile 4 | 0.9542 |
| Decile 3 | 0.7302 |
| Decile 2 | 0.4712 |
| Decile 1 | 0.09179 |
| Minimum | -5.342 |
|
|
- Mean = 1.17393
- Std.dev = 0.87291
- 38 items below graph minimum of -2.09742
- 25 items above graph maximum of 4.47021
|
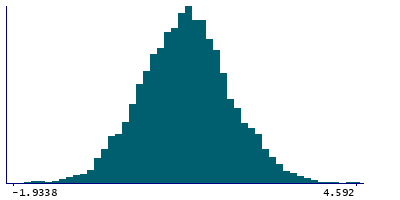
Instance 3 : First repeat imaging visit (2019+)
4,284 participants, 4,284 items
| Maximum | 4.592 |
| Decile 9 | 2.4415 |
| Decile 8 | 2.0225 |
| Decile 7 | 1.7655 |
| Decile 6 | 1.5475 |
| Median | 1.343 |
| Decile 4 | 1.1325 |
| Decile 3 | 0.9048 |
| Decile 2 | 0.63725 |
| Decile 1 | 0.25385 |
| Minimum | -2.971 |
|
|
- Mean = 1.3366
- Std.dev = 0.859168
- 3 items below graph minimum of -1.9338
|