Data
70,319 items of data are available, covering 66,458 participants.
Defined-instances run from 2 to 3, labelled using Instancing
2.
Units of measurement are percent.
| Maximum | 2.39 |
| Decile 9 | 0.285 |
| Decile 8 | 0.233 |
| Decile 7 | 0.199 |
| Decile 6 | 0.172 |
| Median | 0.147 |
| Decile 4 | 0.123 |
| Decile 3 | 0.097 |
| Decile 2 | 0.065 |
| Decile 1 | 0.014 |
| Minimum | -1.908 |
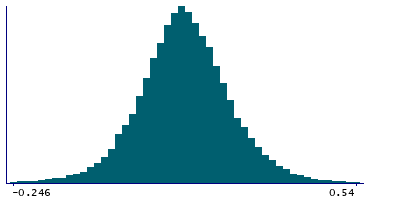
|

|
- Mean = 0.147917
- Std.dev = 0.120879
- 323 items below graph minimum of -0.257
- 198 items above graph maximum of 0.556
|
2 Instances
Instance 2 : Imaging visit (2014+)
66,035 participants, 66,035 items
| Maximum | 2.39 |
| Decile 9 | 0.285 |
| Decile 8 | 0.233 |
| Decile 7 | 0.199 |
| Decile 6 | 0.171 |
| Median | 0.147 |
| Decile 4 | 0.123 |
| Decile 3 | 0.096 |
| Decile 2 | 0.064 |
| Decile 1 | 0.013 |
| Minimum | -1.908 |
|
|
- Mean = 0.147335
- Std.dev = 0.121588
- 312 items below graph minimum of -0.259
- 188 items above graph maximum of 0.557
|
Instance 3 : First repeat imaging visit (2019+)
4,284 participants, 4,284 items
| Maximum | 1.809 |
| Decile 9 | 0.284 |
| Decile 8 | 0.232 |
| Decile 7 | 0.202 |
| Decile 6 | 0.177 |
| Median | 0.156 |
| Decile 4 | 0.134 |
| Decile 3 | 0.109 |
| Decile 2 | 0.079 |
| Decile 1 | 0.034 |
| Minimum | -0.613 |
|

|
- Mean = 0.156887
- Std.dev = 0.108972
- 11 items below graph minimum of -0.216
- 14 items above graph maximum of 0.534
|