Data
70,320 items of data are available, covering 66,459 participants.
Defined-instances run from 2 to 3, labelled using Instancing
2.
Units of measurement are Z.
| Maximum | 8.51 |
| Decile 9 | 4.072 |
| Decile 8 | 3.456 |
| Decile 7 | 3.015 |
| Decile 6 | 2.645 |
| Median | 2.301 |
| Decile 4 | 1.963 |
| Decile 3 | 1.599 |
| Decile 2 | 1.174 |
| Decile 1 | 0.5742 |
| Minimum | -7.125 |
|
|
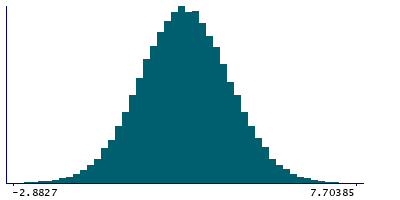
- Mean = 2.30804
- Std.dev = 1.37971
- 40 items below graph minimum of -2.9236
- 8 items above graph maximum of 7.5698
|
2 Instances
Instance 2 : Imaging visit (2014+)
66,036 participants, 66,036 items
| Maximum | 8.224 |
| Decile 9 | 4.062 |
| Decile 8 | 3.44 |
| Decile 7 | 3.002 |
| Decile 6 | 2.632 |
| Median | 2.288 |
| Decile 4 | 1.951 |
| Decile 3 | 1.589 |
| Decile 2 | 1.163 |
| Decile 1 | 0.5617 |
| Minimum | -7.125 |
|

|
- Mean = 2.2953
- Std.dev = 1.38001
- 37 items below graph minimum of -2.9386
- 7 items above graph maximum of 7.5623
|
Instance 3 : First repeat imaging visit (2019+)
4,284 participants, 4,284 items
| Maximum | 8.51 |
| Decile 9 | 4.2445 |
| Decile 8 | 3.635 |
| Decile 7 | 3.2245 |
| Decile 6 | 2.845 |
| Median | 2.501 |
| Decile 4 | 2.1645 |
| Decile 3 | 1.8045 |
| Decile 2 | 1.363 |
| Decile 1 | 0.8079 |
| Minimum | -3.437 |
|

|
- Mean = 2.50444
- Std.dev = 1.35999
- 2 items below graph minimum of -2.6287
- 1 item above graph maximum of 7.6811
|