Data
70,320 items of data are available, covering 66,459 participants.
Defined-instances run from 2 to 3, labelled using Instancing
2.
Units of measurement are Z.
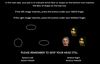
| Maximum | 8.3 |
| Decile 9 | 4.291 |
| Decile 8 | 3.746 |
| Decile 7 | 3.341 |
| Decile 6 | 2.988 |
| Median | 2.656 |
| Decile 4 | 2.32 |
| Decile 3 | 1.95 |
| Decile 2 | 1.495 |
| Decile 1 | 0.8375 |
| Minimum | -5.722 |
|
|
- Mean = 2.59584
- Std.dev = 1.38188
- 72 items below graph minimum of -2.616
- 3 items above graph maximum of 7.7445
|
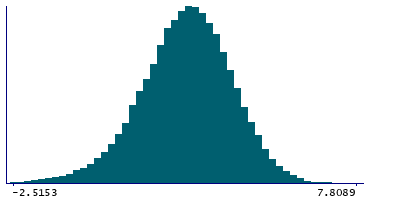
2 Instances
Instance 2 : Imaging visit (2014+)
66,036 participants, 66,036 items
| Maximum | 8.3 |
| Decile 9 | 4.2885 |
| Decile 8 | 3.743 |
| Decile 7 | 3.336 |
| Decile 6 | 2.982 |
| Median | 2.649 |
| Decile 4 | 2.313 |
| Decile 3 | 1.942 |
| Decile 2 | 1.4885 |
| Decile 1 | 0.82845 |
| Minimum | -5.722 |
|
|
- Mean = 2.589
- Std.dev = 1.38415
- 70 items below graph minimum of -2.6316
- 2 items above graph maximum of 7.74855
|
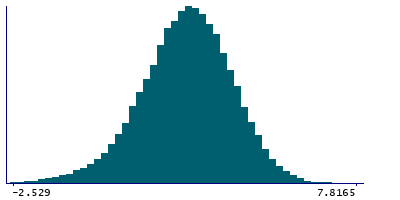
Instance 3 : First repeat imaging visit (2019+)
4,284 participants, 4,284 items
| Maximum | 7.8 |
| Decile 9 | 4.357 |
| Decile 8 | 3.7945 |
| Decile 7 | 3.4135 |
| Decile 6 | 3.072 |
| Median | 2.772 |
| Decile 4 | 2.425 |
| Decile 3 | 2.068 |
| Decile 2 | 1.626 |
| Decile 1 | 0.9989 |
| Minimum | -2.742 |
|
|
- Mean = 2.70137
- Std.dev = 1.34202
- 4 items below graph minimum of -2.3592
- 1 item above graph maximum of 7.7151
|