Data
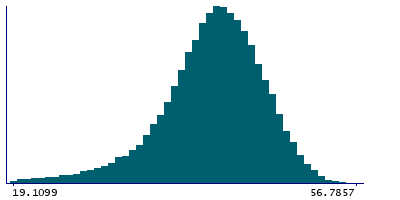
78,625 items of data are available, covering 74,332 participants.
Defined-instances run from 2 to 3, labelled using Instancing
2.
Units of measurement are ms.
| Maximum | 57.1799 |
| Decile 9 | 47.4232 |
| Decile 8 | 45.4144 |
| Decile 7 | 43.9129 |
| Decile 6 | 42.5877 |
| Median | 41.3046 |
| Decile 4 | 40.0176 |
| Decile 3 | 38.5037 |
| Decile 2 | 36.5253 |
| Decile 1 | 33.1169 |
| Minimum | 0 |
|

|
- Mean = 40.5237
- Std.dev = 6.29552
- 877 items below graph minimum of 18.8107
|
2 Instances
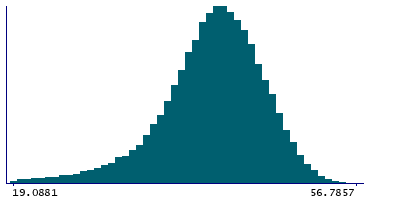
Instance 2 : Imaging visit (2014+)
73,987 participants, 73,987 items
| Maximum | 57.1799 |
| Decile 9 | 47.4346 |
| Decile 8 | 45.4196 |
| Decile 7 | 43.9189 |
| Decile 6 | 42.5934 |
| Median | 41.3112 |
| Decile 4 | 40.0175 |
| Decile 3 | 38.5058 |
| Decile 2 | 36.5288 |
| Decile 1 | 33.1118 |
| Minimum | 0 |
|

|
- Mean = 40.5276
- Std.dev = 6.3014
- 816 items below graph minimum of 18.7889
|
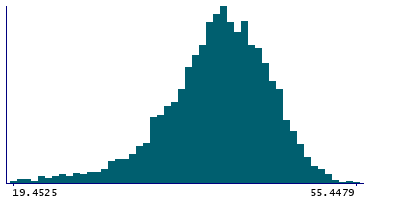
Instance 3 : First repeat imaging visit (2019+)
4,638 participants, 4,638 items
| Maximum | 55.4479 |
| Decile 9 | 47.2585 |
| Decile 8 | 45.3187 |
| Decile 7 | 43.8142 |
| Decile 6 | 42.4717 |
| Median | 41.2372 |
| Decile 4 | 40.0201 |
| Decile 3 | 38.4403 |
| Decile 2 | 36.4543 |
| Decile 1 | 33.3457 |
| Minimum | 8.89375 |
|

|
- Mean = 40.4616
- Std.dev = 6.20062
- 59 items below graph minimum of 19.4328
|
Notes
Median T2star in left accumbens (from SWI data)
0 Related Data-Fields
There are no related data-fields
2 Applications
| Application ID | Title |
|---|
| 17689 | Genetic, environmental and lifestyle predictors of brain/cognitive-related outcomes. |
| 22783 | The joint analysis of imaging data and genetic data for early tumor detection, prevention, diagnosis and treatment |


